When Donald Trump was sworn in as the 47th president of the United States, he declared the arrival of a new “golden age”.
About 100 days into his second term, those investors who believed his words and bought gold reaped rich rewards.
However, those who took his views seriously and bought large amounts of US stocks and dollars were disappointed. So were the buyers of US Treasury bonds, who even began to doubt the safe-haven status of US debt.
Rather than strengthening the US economy and market dominance through a series of tax cuts and deregulation, the new government has instead triggered the most extreme market volatility in modern history due to tariffs and geopolitical uncertainties.
Despite a recent period of stability, the S&P 500 index has dropped by approximately 8% since he took office and is on track to record the worst performance since President Ford’s first 100 days in office following Richard Nixon’s resignation in 1974.
After the stock market rose by more than 20% for two consecutive years and was expected to introduce a growth-friendly agenda, few Wall Street insiders anticipated such a reversal. However, as Trump imposed tariffs on almost all the countries where American companies operate in the US – and then suspended tariffs on some countries, provided exceptions for certain industries, and intensified the trade war with China, the market fluctuated significantly.
These chaotic situations, coupled with the government’s vigorous efforts to deport undocumented workers and large-scale layoffs of federal employees, have unsettled investors and led to the seventh-fastest correction of the S&P 500 index since 1929.
Bitcoin was the star asset in Trump’s presidential campaign that supported cryptocurrencies, but it has always struggled to maintain its momentum.
According to data compiled by Bloomberg, despite the early hype around Bitcoin, the largest digital asset has fallen by more than 7% since Trump took office, even though the entire industry has achieved significant policy victories.
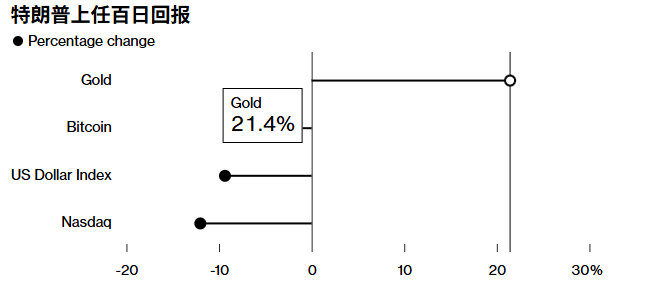
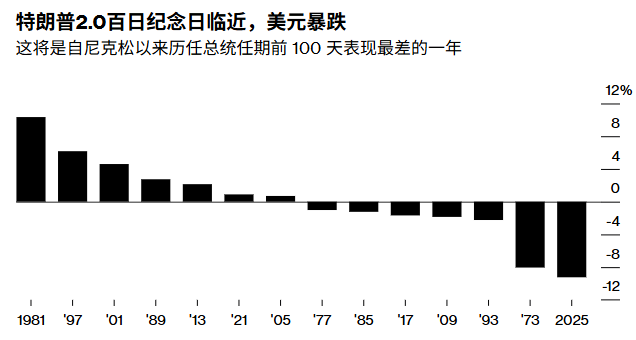
Since Trump returned to the White House, the US dollar index has dropped by about 9%, and is on track to record the biggest monthly decline since the early 1970s when the US abandoned the gold standard and allowed the dollar to float freely.
Over the past few decades, the first 100 days of a president’s term have been marked by a strengthening currency. From Richard Nixon’s second term in 1973 to Joe Biden’s inauguration in 2021, the average return was close to 0.9%.
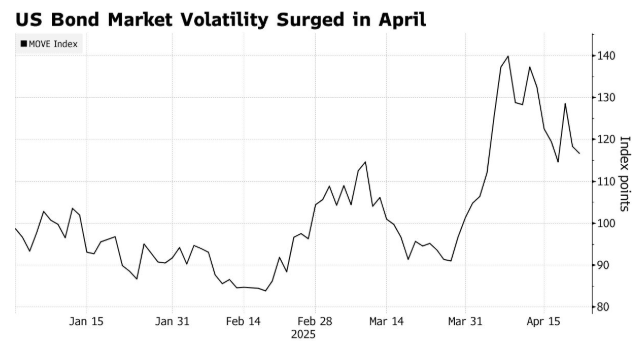
Over the past 100 days, the $29 trillion US Treasury market has experienced the most violent fluctuations in decades.
After Trump announced a series of tariffs on almost all of the US’s trading partners and stimulated investors’ demand for safe-haven assets, US Treasury bond prices rose, and the yield on 10-year Treasury bonds once dropped to 3.86% in early April.
But as concerns spread on Wall Street that the escalation of the trade war would lead the US economy into recession, investors rushed to sell US Treasuries, and this interest quickly dissipated. The benchmark rate rose by the most in a week since 2001, reaching 4.59%.
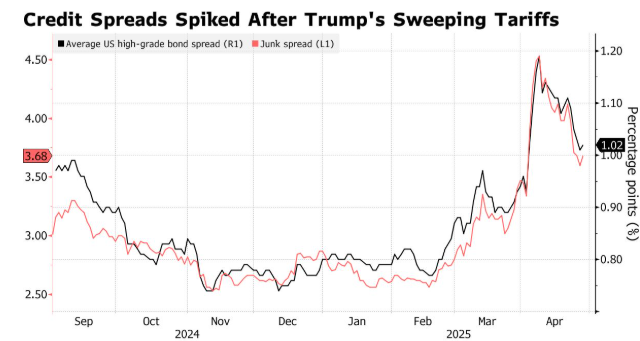
When Trump was elected, the credit market initially flourished. In November, the risk premium on US blue-chip corporate bonds dropped to its lowest level since 1998. But it turned out to be a brief moment of glory. Trump’s comprehensive tariff policy completely overturned the bond market, triggering the most severe crash since the pandemic.
In the days following the announcement of tariffs on April 2, risk indicators in the US and European corporate bond markets rose by the most since the regional banking crisis and the bankruptcy of Credit Suisse in March 2023. The yield that investors demand for holding global junk bonds over government bonds soared in the most severe sell-off since March 2020.
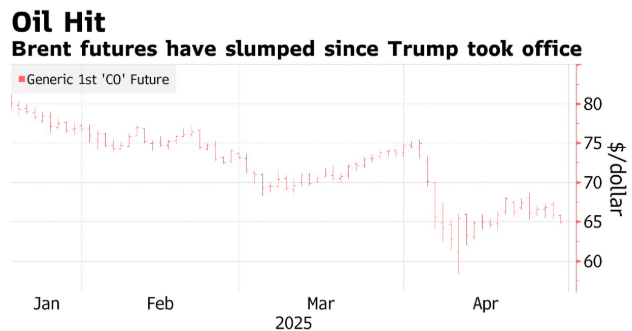
The sharp drop in oil prices and the gloomy economic outlook caused by the tariff war are important reasons for this phenomenon.
Meanwhile, the Organization of the Petroleum Exporting Countries and its allies have begun to restore supplies, seemingly to punish those countries that violated production quotas.
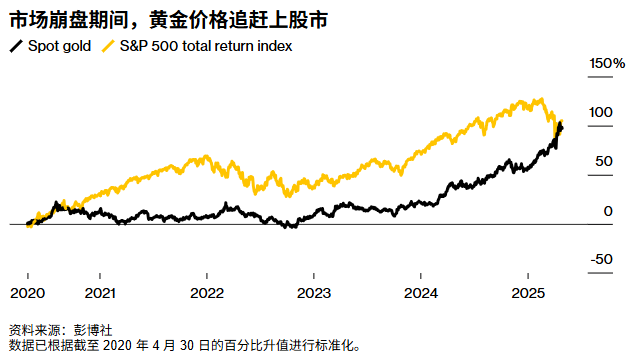
Gold is one of the few assets that have benefited from the current turmoil. Since Trump won the election on November 5th, the price of gold has hit 28 new highs. The price of gold initially plunged as traders were worried that Trump’s tariff policy would affect gold. The price of US gold futures soared, pushing up global gold prices, as traders rushed to ship gold back to the US before the tariffs were implemented.
Technical analysis:
Gold: Yesterday, the price dropped to the green area we were alerted by the plugin, and immediately a bottoming signal appeared on the K-line. It rebounded all the way above 3330, but due to the weak recent trend, it oscillated and fell back above 3330. Today, the price has once again returned to the area near the 3300 mark. We need to be cautious about the bulls today and be on guard against a flash crash in the offshore market. However, after a flash crash, we still need to consider the rebound buying operation after the liquidity is swept. For detailed positions, please consult the plugin.
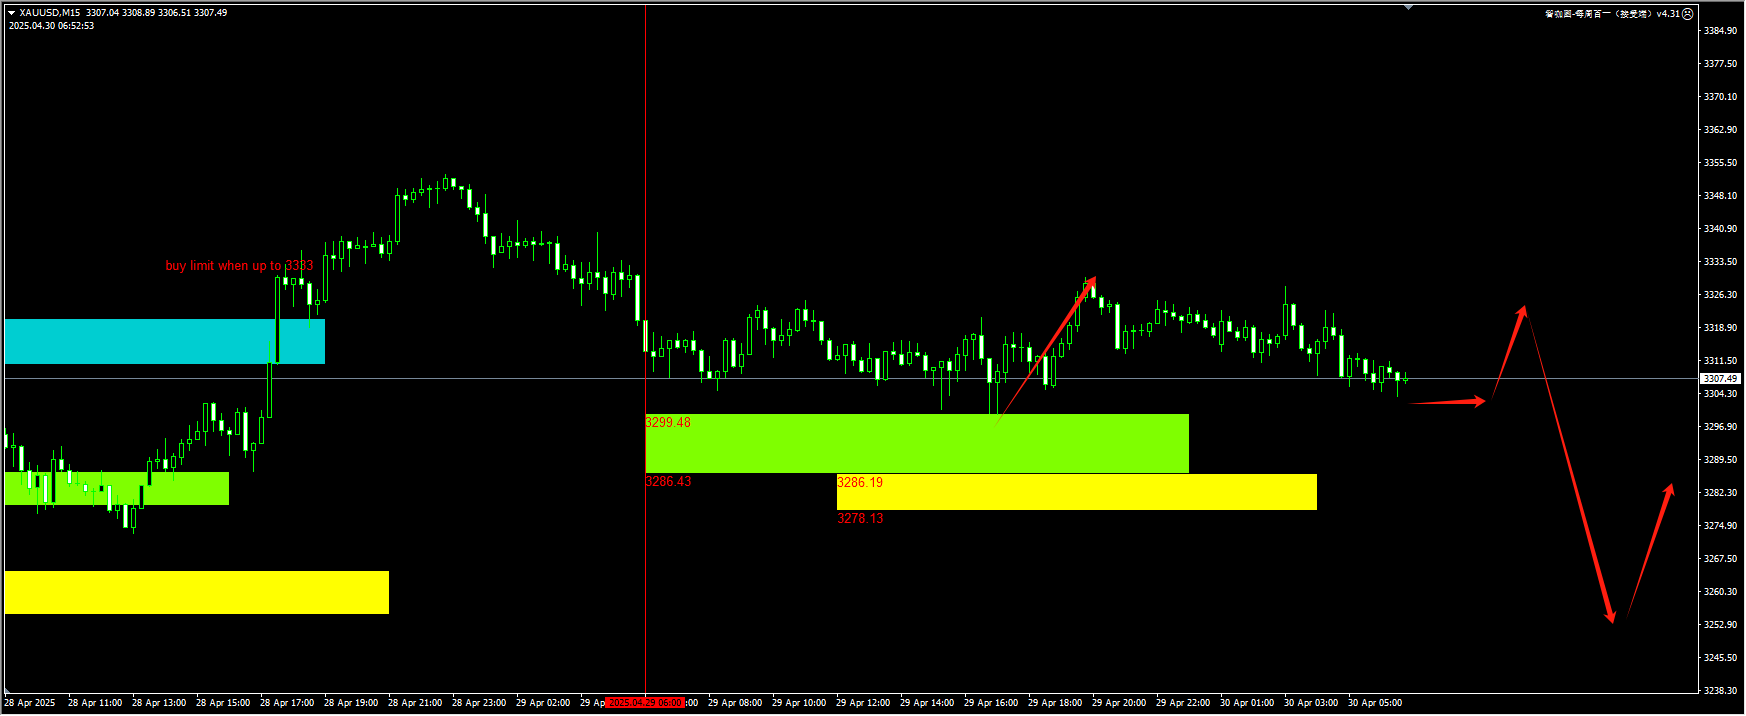
(Gold 15-minute chart)
The plugin is updated from 12:00 to 13:00 every trading day. If you want to experience the same plugin as shown in the chart, please contact V: Hana-fgfg and write “666” in the message.
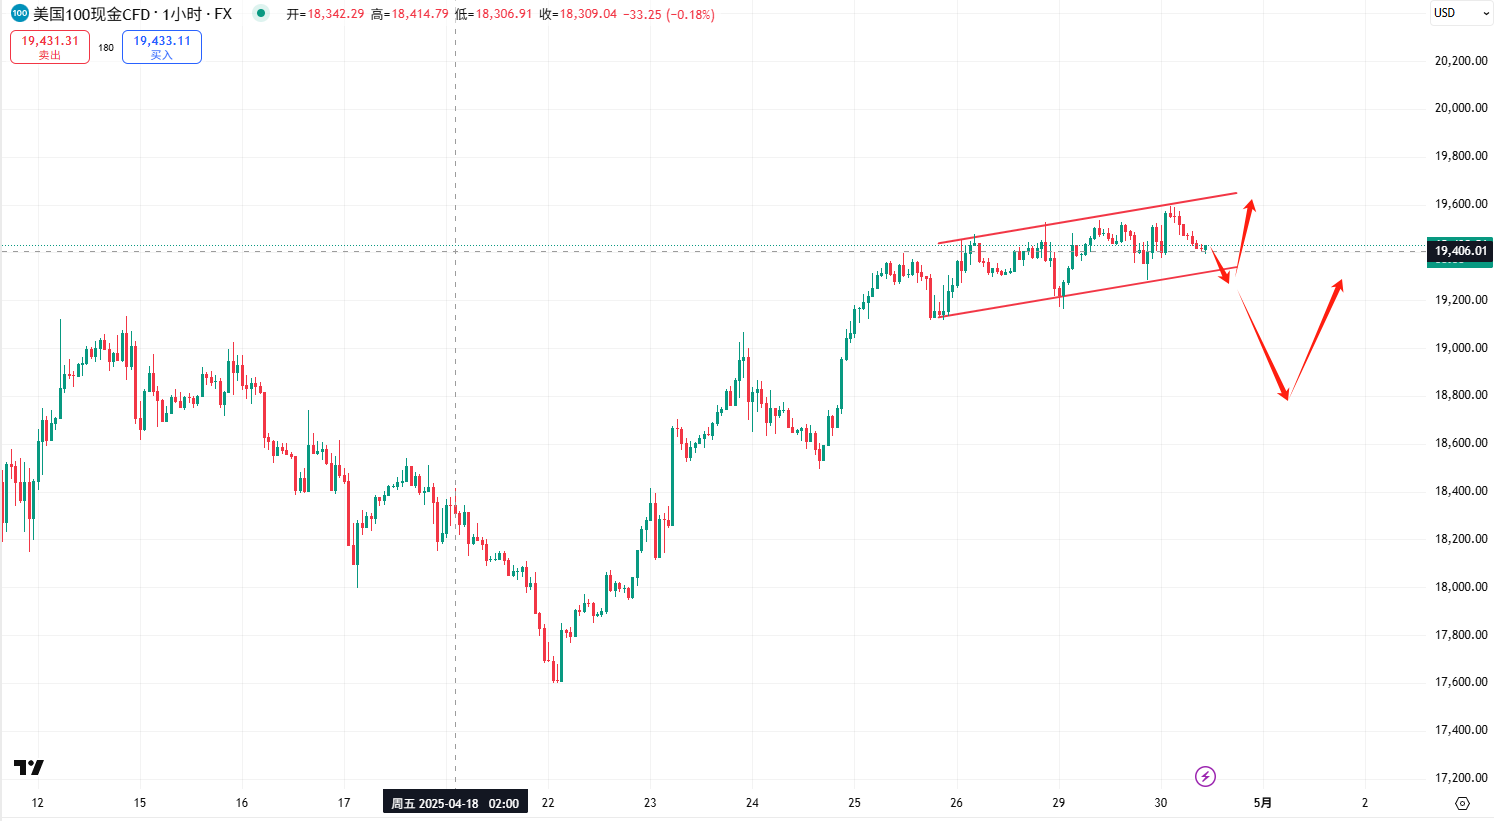
Nasdaq: The price maintains a regular consolidation pattern within the channel. If you can monitor the market intraday, consider buying near the lower track of the channel. The rebound target is seen near the upper track. Do not aim for overly large short-term gains. On the other hand, if the price breaks below the track, wait for the 19,000 level to be cleared and then consider buying at a lower level. For specific positions, please consult the plugin.
(NASDAQ 15-minute chart)
The plugin is updated from 12:00 to 13:00 every trading day. If you want to experience the same plugin as shown in the chart, please contact V: Hana-fgfg and note “666” in the message.
Crude oil: Due to Trump’s 90-day suspension of full reciprocal tariffs, the pressure on oil prices from recession concerns has been greatly alleviated. Currently, the price needs to retest the previous low. If it does not continue to set new lows, it is more likely to form a bottom pattern in the future. Therefore, at present, it is necessary to observe more and act less, and wait for the 57-57.50 area to be tested before looking for a new demand zone to try long positions. For detailed positions, please consult the plugin.
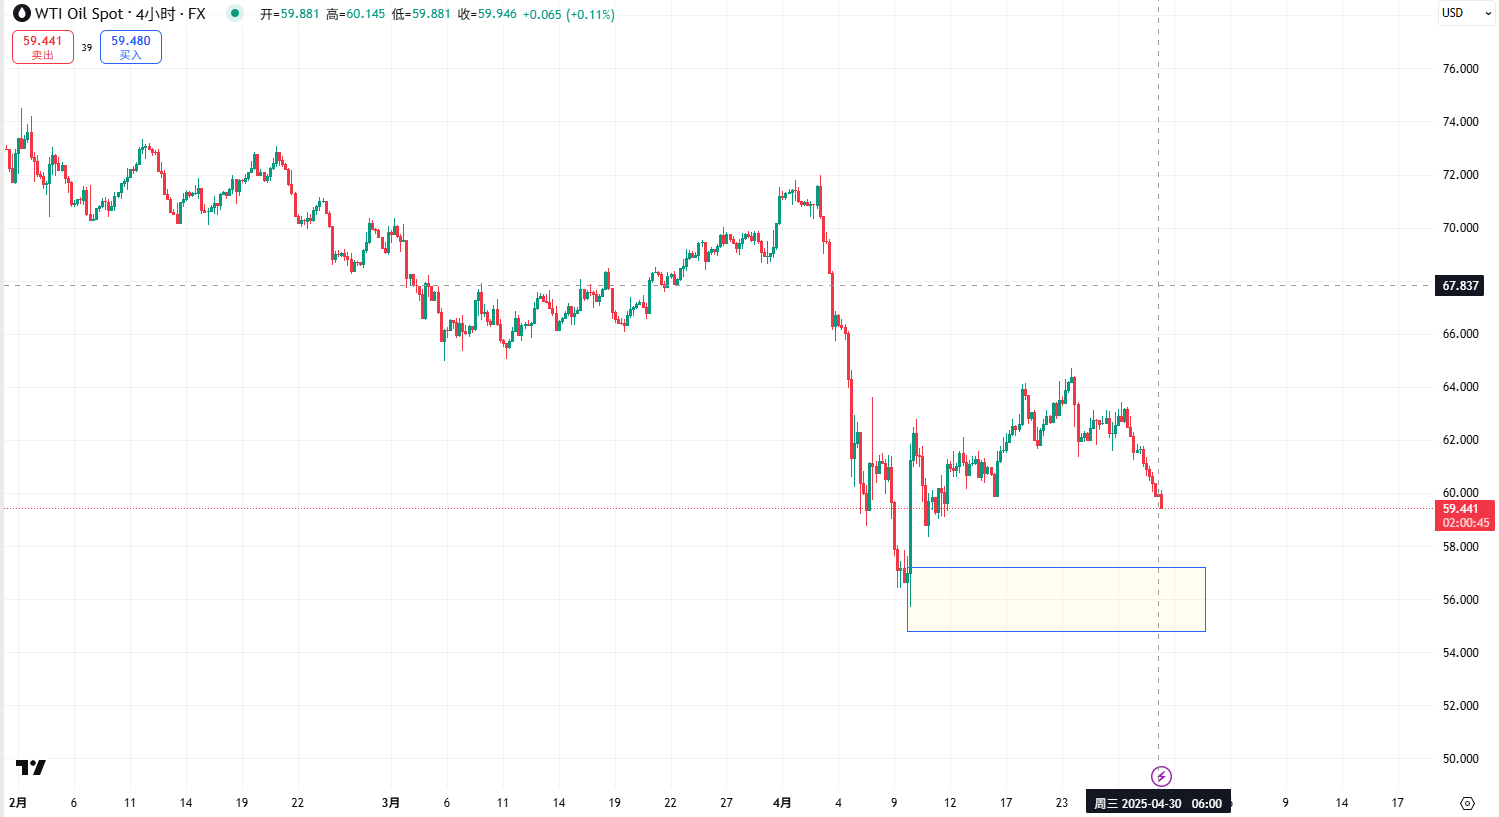
(Crude Oil 15-Minute Chart)
The plugin is updated from 12:00 to 13:00 every trading day. If you want to experience the same plugin as shown in the picture, please contact V: Hana-fgfg and note “666” in the message.
Today’s key economic data and events to focus on:
15:55 Germany’s seasonally adjusted unemployment rate for April (official)
16:00 Germany’s seasonally adjusted GDP preliminary estimate for the first quarter (quarterly rate)
17:00 Eurozone Q1 GDP Preliminary (q/q)
20:00 Germany April Harmonized Index of Consumer Prices (HICP) flash estimate (y/y)
20:15 US April ADP Employment Change (thousands)
20:30 Canadian February GDP
20:30 US Preliminary Personal Consumption Expenditures Price Index for the First Quarter (Annualized Quarterly Rate)
20:30 US First Quarter Preliminary Real GDP (Annualized Quarterly Rate)
22:00 US Personal Consumption Expenditures for March
