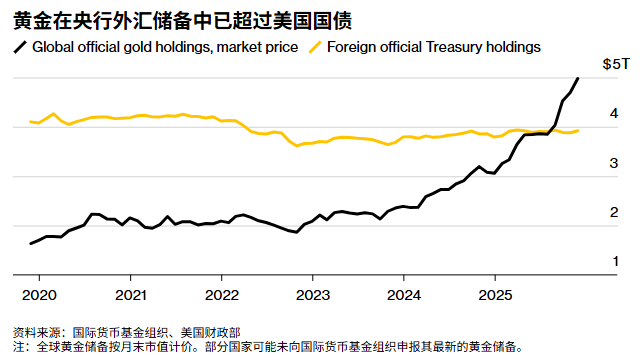
The price of gold has broken through the $5,000-per-ounce mark for the first time, continuing its rapid rise driven by US President Donald Trump’s efforts to reshape international relations and investors’ selling of sovereign bonds and currencies.
Gold prices climbed to around $5,040 per ounce, with gains of more than 8% last week. Geopolitical risks and a weakening dollar have boosted demand. The key dollar index recorded its biggest weekly decline since May, reducing the cost for most buyers to purchase precious metals. Silver prices also hit a record high, breaking through $100 per ounce in the previous trading day.
The astonishing rise in the price of gold – it has more than doubled in the past two years – highlights the metal’s historical status as an indicator of market panic. Gold has just recorded its best annual performance since 1979, having risen by more than 15% so far this year, mainly due to what is known as the “devaluation trade”, where investors sell off currencies and government bonds. The massive sell-off in Japan’s bond market last week is the latest example of investors’ rejection of huge fiscal spending.
In recent weeks, a series of moves by the Trump administration – including attacking the independence of the Federal Reserve, threatening to annex Greenland and considering military intervention in Venezuela – have also panicked the market. For investors hoping to deal with this uncertainty, the safe-haven appeal of gold has never been as strong as it is now.
“Gold is the opposite of confidence,” said Max Belmont, portfolio manager at First Eagle Investment Management. “It can hedge against unexpected inflation, unexpected market declines and the intensification of geopolitical risks.”
Apart from geopolitical factors, the ballooning public debt in developed economies has also become another key pillar supporting the rise in gold prices. Some long-term investors firmly believe that inflation will be the only way for countries to achieve solvency, and thus they are snapping up gold to preserve its value.
John Reade, chief strategist at the World Gold Council, said: “Over the past three years, concerns about the long-term debt trend have been growing. I have found that in family offices, the concerns about currency devaluation and debt issues are the most intense. They are thinking about the protection of intergenerational wealth, not short-term interests.”
This depreciation trade peaked at the end of 2025, when prominent investors such as Ken Griffin, CEO of Citadel Securities, and Ray Dalio, founder of Bridgewater Associates, pointed out that the rise in gold was a warning signal.
Technical analysis:
The functions of WeChat are subject to occasional restrictions. If you want to try the plugin, please leave your contact information when adding a friend so that we can add you back easily!!!
Gold: The price has first broken through the $5,000 per ounce mark. However, currently, there are almost no bearish factors in the market, all being long-term bullish factors. Therefore, the overall direction should still be dominated by a bullish mindset. Considering the increase in point value, the absolute value of price fluctuations may rise. Within the day, it is recommended to prioritize looking for pullback demand areas or after sweeping liquidity, then look for rebound signals. The focus areas are around 5020 and 4980. Additionally, if the price stabilizes directly at 5050 and continues to rise, it is also advisable to consider participating in a short-term long position. For detailed positions, please consult the plugin.
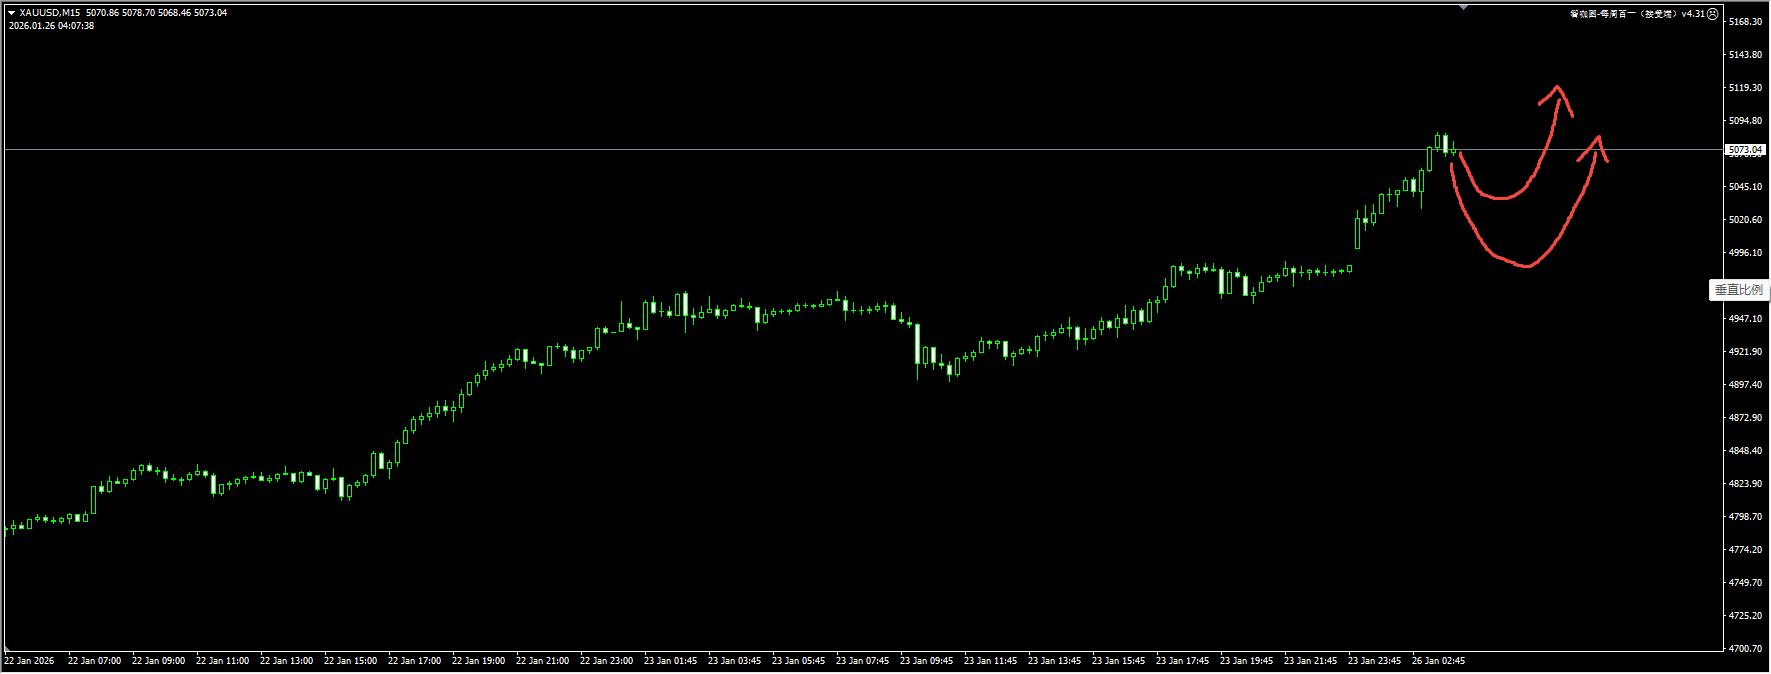
(Gold 15-minute chart)
The plugin is updated from 12:00 to 13:00 every trading day. If you want to experience the same plugin as shown in the chart, please contact V: Hana-fgfg and leave your contact information for us to get back to you.
The Nasdaq: The price is consolidating expansively around 25,500. With the earnings reports of the 7 major US stocks coming out this week, it is expected that the price may still fluctuate within a range. Therefore, a more reasonable operation is to look for demand zones or sweep liquidity at the lower end of the current range, capture the long rebound signal, and then hold the advantageous position until the earnings reports are released. For detailed positions, please consult the plugin.
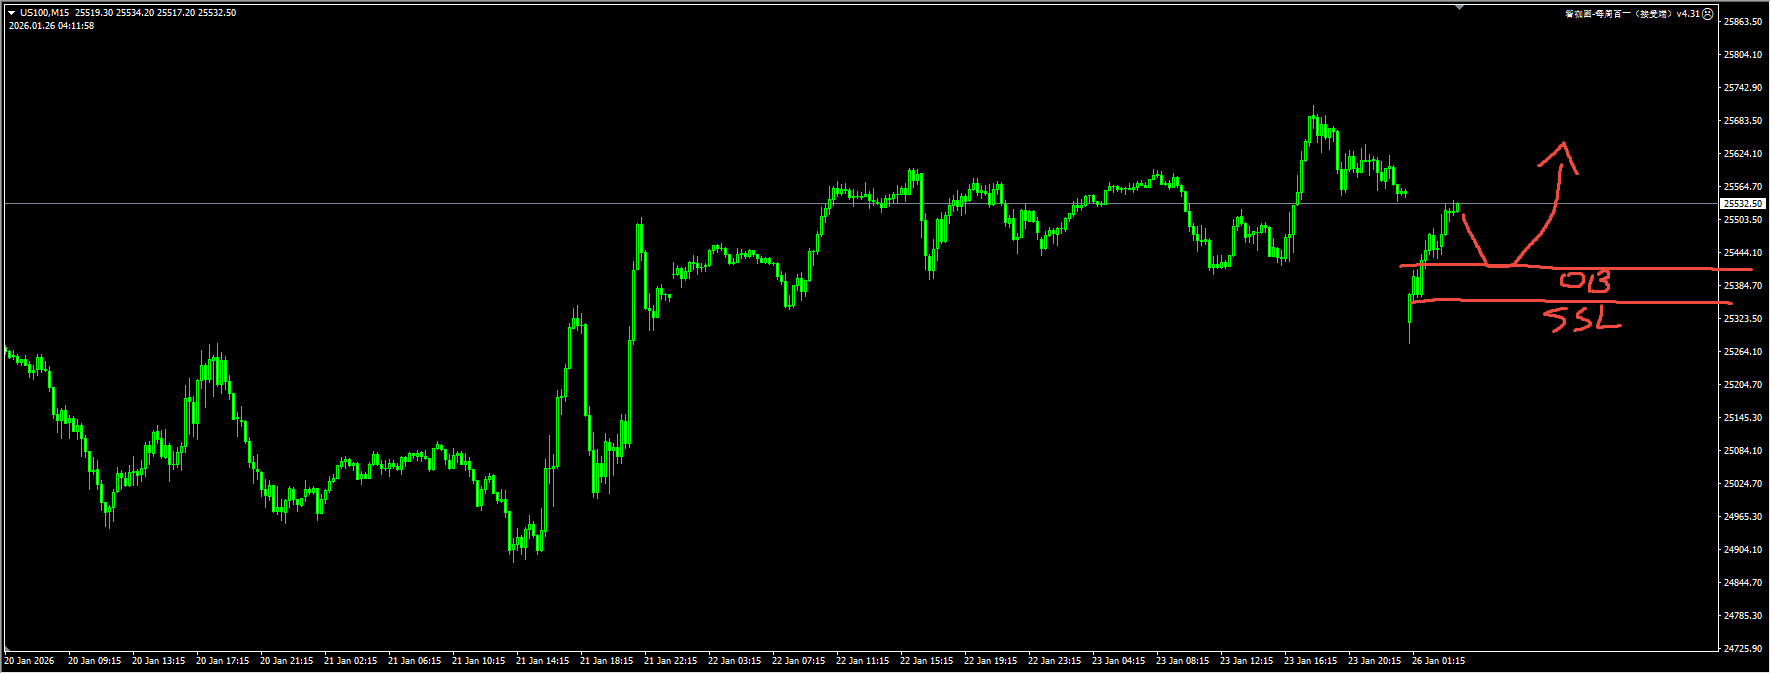
(NASDAQ 15-minute chart)
The plugin is updated from 12:00 to 13:00 every trading day. If you want to experience the same plugin as shown in the chart, please contact V: Hana-fgfg and leave your contact information in the message for us to get back to you.
Crude oil: There is a pullback confirmation signal after a structural breakthrough in the 60-61 range, but it has not yet broken through 61.55 to open up new upside space. Within the day, close attention should be paid to the situation of sweeping liquidity near 60; in addition, only when the price recovers 61.55 can short-term chasing highs be considered. For detailed positions, please consult the plugin.
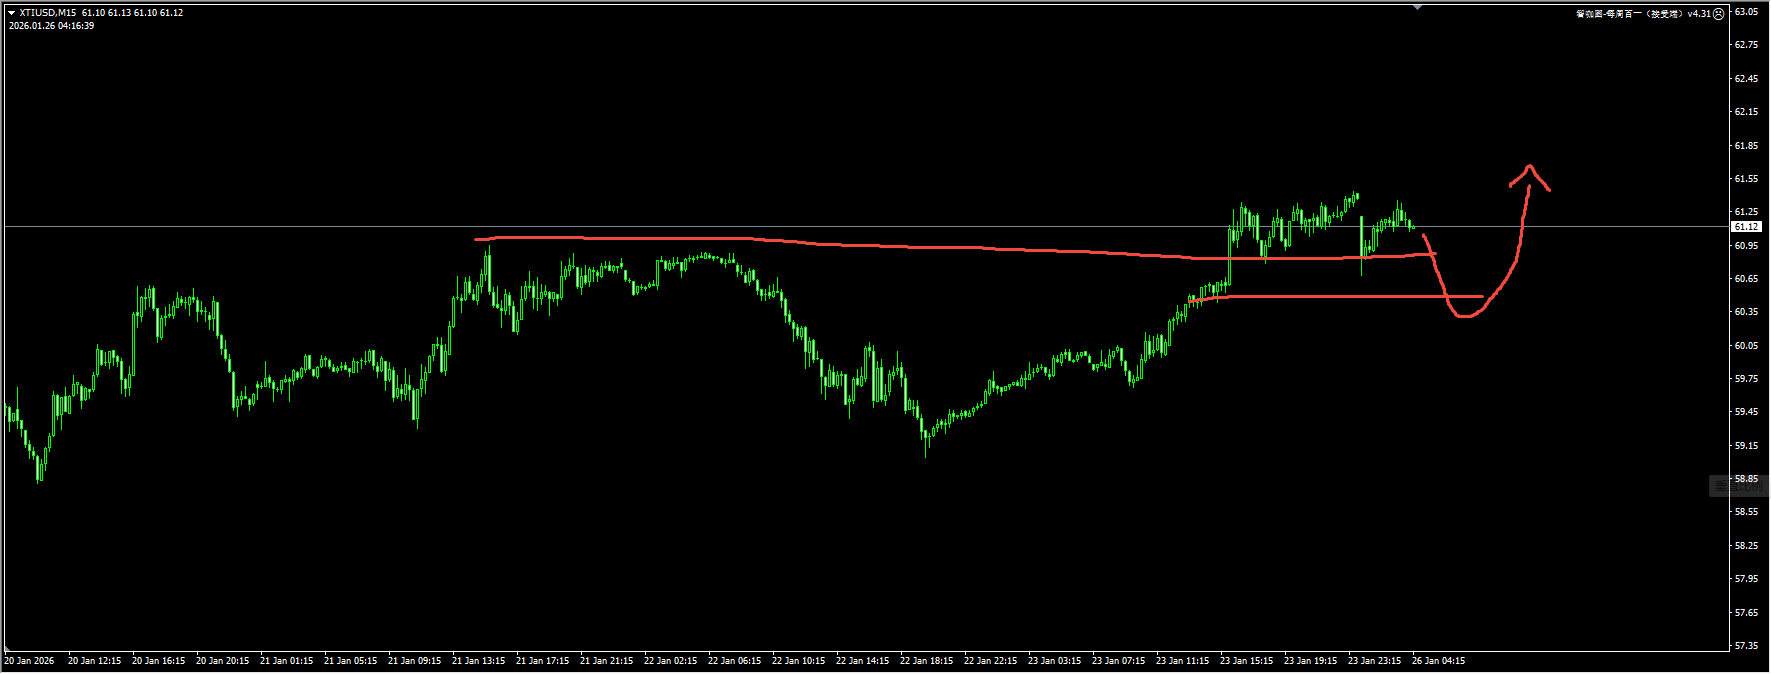
(Crude Oil 15-Minute Chart)
The plugin is updated from 12:00 to 13:00 every trading day. If you want to experience the same plugin as shown in the picture, please contact V: Hana-fgfg and leave your contact information in the message for us to reply.
Today’s key financial data and events to focus on:
17:00 Germany January IFO Business Climate Index
21:30 US November Durable Goods Orders (MoM) Preliminary Estimate
23:30 US Dallas Fed Manufacturing Index for January
