U.S. stock index futures rose and oil prices retreated after President Donald Trump signed a temporary deal to end the war with Iran and reopen the Strait of Hormuz, boosting risk sentiment following the Federal Reserve’s hawkish stance.
S&P 500 futures rose as much as 0.9%, while Nasdaq futures gained 1.5%. The U.S. benchmark indices fell 1.2% after the Federal Reserve on Wednesday signaled that further rate hikes might be needed to curb inflation. Brent crude oil prices dropped more than 2%, falling below $78 a barrel. European stock futures declined, while Asian equities advanced for the fifth consecutive trading day.
“Trump’s signing of a memorandum of understanding with Iran brought an unexpected positive surprise to the stock market,” said Rajeev De Mello, global macro portfolio manager at Gama Asset Management. “Although markets had already anticipated a gradual resumption of shipping through the Strait of Hormuz, the risk of last-minute talks collapsing remained. This agreement significantly reduces that risk.”
Trump told reporters he signed the document at the Palace of Versailles near Paris. A U.S. official said the memorandum of understanding has now taken effect. However, it remains unclear whether Iran has immediately taken steps to fully reopen the Strait of Hormuz.
After the Federal Reserve’s decision was released, the 10-year U.S. Treasury yield rose by about 5 basis points before retreating 4 basis points to 4.45%. The 2-year U.S. Treasury yield, highly sensitive to policy expectations, declined 2 basis points to 4.16% after rising 13 basis points in the previous trading session. However, Australia and Japan’s 10-year government bond yields edged higher on Thursday.
Market optimism over the potential U.S.-Iran deal to ease geopolitical tensions and reduce the risk of further global energy supply disruptions has provided another positive boost to global equities. Despite the turmoil caused by the war, stock markets have remained largely unaffected and have continued to hit new highs, driven by sustained strength in artificial intelligence.
However, bond investors still face ongoing inflation risks, which could keep expectations of prolonged high interest rates unchanged. Despite a decline in oil prices, inventory pressures remain significant. Crude oil inventories at Cushing, the largest commercial storage hub in the United States, have fallen to around 20 million barrels—traders consider this the lowest operational level.
The Fed’s decision marks the fourth consecutive time it has kept interest rates unchanged. Officials described economic growth as “solid,” highlighted strong productivity gains and capital investment, and made clear that inflation concerns are more pressing than a weak labor market.
About half of the Federal Reserve’s policymakers expect a rate hike this year, prompting traders to fully price in the tightening by October and consider a September increase highly likely.
Federal Reserve Chair Kevin Warsh declined to offer guidance on the next steps in policy during his first press conference since taking office. He emphasized that inflation has remained above the Fed’s 2% target for several consecutive years and reiterated the central bank’s commitment to restoring price stability.
Bob Mitchell, Chief Investment Officer and Global Fixed Income Head at J.P. Morgan Asset Management, said: “Half of the committee members are expected to raise interest rates this year, which is undoubtedly a blow to the market. I believe they are preparing for a rate hike.”
Wash also announced the creation of a special task force to review the Federal Reserve’s $6.7 trillion balance sheet, an issue he has long criticized. He said the task force would examine “whether monetary policy comes from interest rate tools or balance sheet tools.”
Technical Analysis:
WeChat features may be temporarily restricted. If you’d like to try the plugin, please add us as a friend and note “plugin trial” in the message, along with your contact information so we can easily get back to you!
Gold: After the price initially broke above 4355, it completed the buy opportunity on the blue zone retracement as indicated by our plugin alert. Then it declined sharply, testing the yellow zone liquidity sweep reminder, followed by two relatively clear rebounds. For today, we continue with two strategies: a liquidity sweep near 4260 on the lower side, and a buy on the blue zone retracement after breaking above 4350. For exact positions, please consult the plugin.
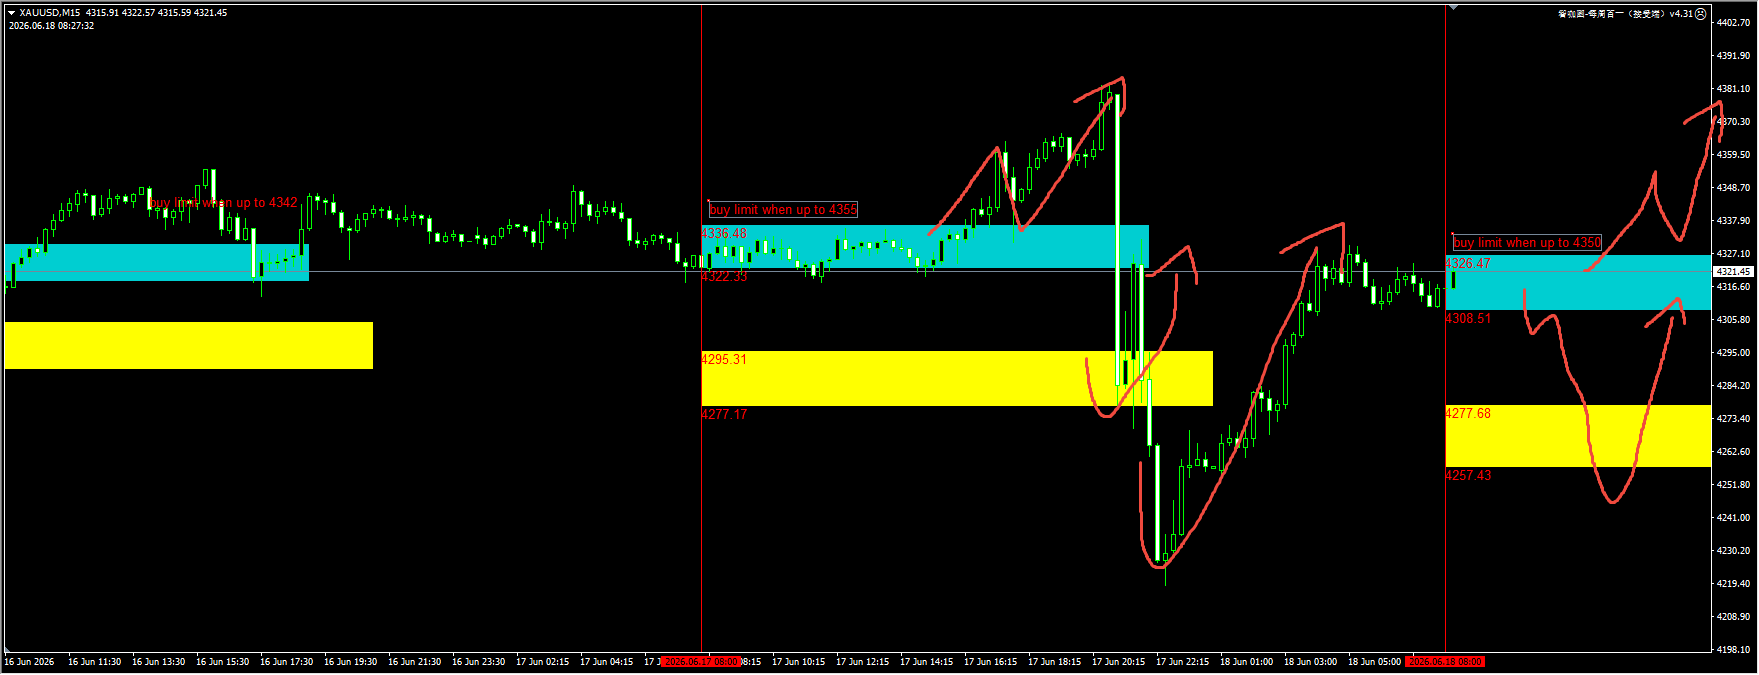
(Gold 15-minute chart)
The plugin is updated daily from 12:00 to 13:00. To try the same plugin shown in the image, please contact V: krabs1942 and leave your contact information so we can add you back.
Nasdaq: After the liquidity sweep below the yellow zone we highlighted yesterday, we captured a rebound, achieving a risk-reward ratio of over 1:1. Today, we continue to monitor the continuation of this rebound, waiting for a breakout above 30,250 before entering a buy limit at the blue zone on pullback. For detailed positions, please consult the plugin.
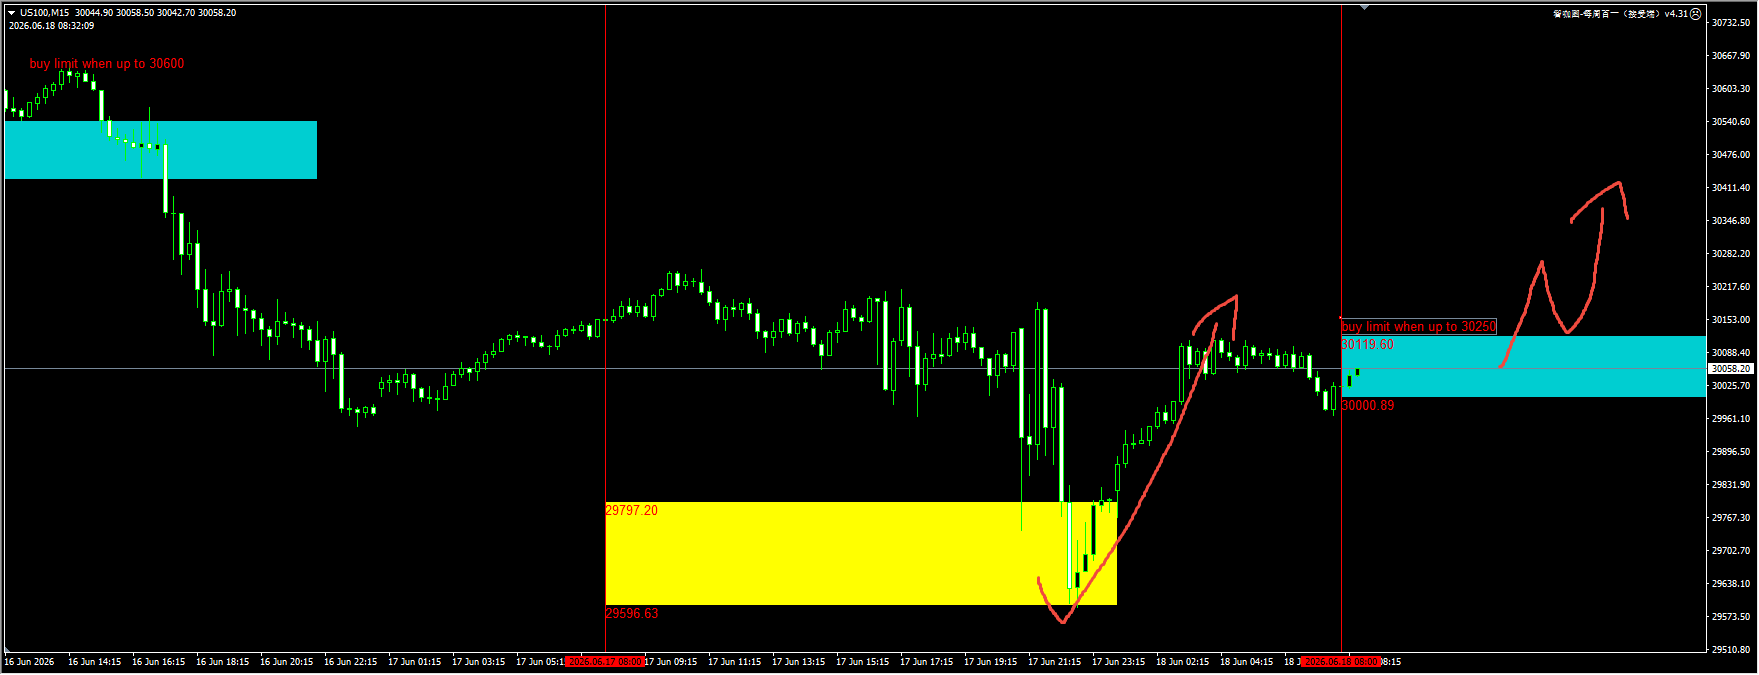
(NASDAQ 15-minute chart)
The plugin is updated daily from 12:00 to 13:00. To try the same plugin shown in the image, please contact V: krabs1942 and leave your contact information so we can add you back.
Crude Oil: Yesterday, after we arranged for the crude oil to sweep up through the yellow liquidity zone, it dropped back below the lower boundary of the colored block, prompting us to place a sell stop. This move proved highly profitable. For today, we will continue with our previous strategy, focusing on potential bearish signals that emerge following the liquidity sweep around 76.50–77. For detailed positioning, please consult the plugin.
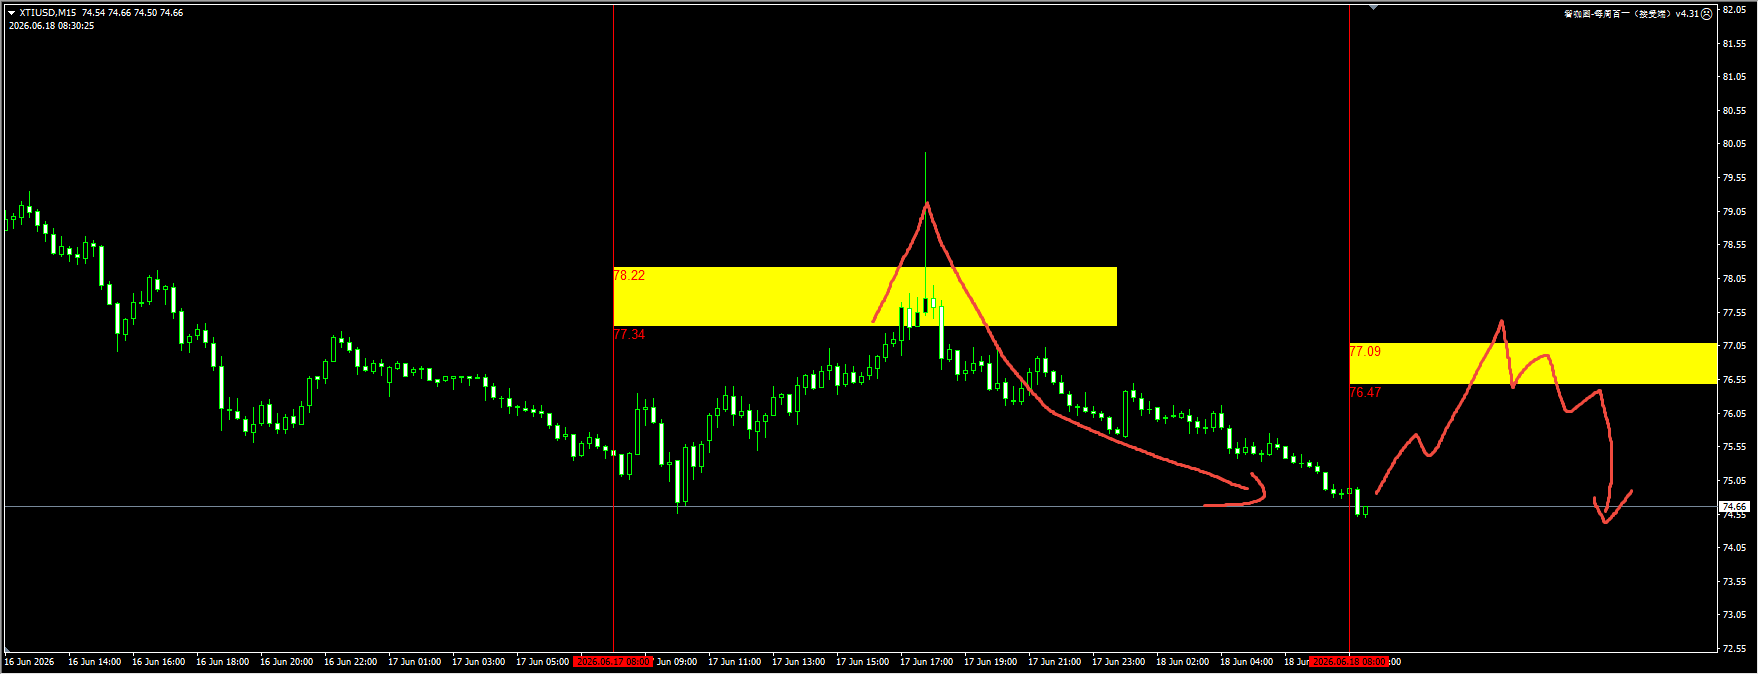
(Crude Oil 15-minute Chart)
The plugin is updated daily from 12:00 to 13:00. If you’d like to try the same plugin shown in the image, please contact V: krabs1942 and leave your contact information so we can add you back.
Today’s key financial data and events to watch:
20:30 U.S. Initial Jobless Claims (Seasonally Adjusted), Thousands (as of 0613)
22:00 U.S. Conference Board Leading Indicator for May