Europe’s historic shift towards increased fiscal spending has prompted asset managers to raise their bullish euro positions to a five-month high, while hedge funds have reduced their bets on the euro’s weakness.
Just days after Germany announced it would loosen its fiscal reins and spend hundreds of billions of euros to revamp European defense, fund managers increased their positions benefiting from a stronger euro to 262,759 contracts in the week ending March 11. Commodity Futures Trading Commission data showed that hedge funds also cut their euro short positions to the lowest level since October.
These changes highlight a global rethink of the euro’s trajectory after Germany pledged to ease fiscal constraints and encourage other European countries to follow suit. Strategists at Société Générale have raised their euro forecasts, joining institutions such as Goldman Sachs and Deutsche Bank in issuing more optimistic predictions.
Kit Juckes, head of foreign exchange strategy at Société Générale, said in a report on Monday that changes to Germany’s debt brake rules could mean that the euro is unlikely to return to parity with the dollar for at least a decade. The French bank currently predicts that the euro will rise nearly 5% from its current level of just under $1.09 to $1.13 by the end of the fourth quarter.
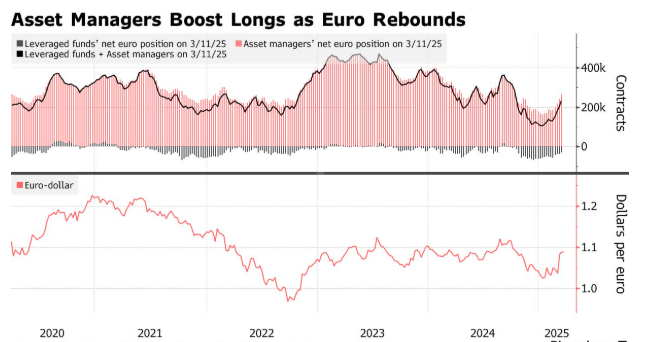
Goldman Sachs strategists Kamakshya Trivedi et al. wrote in a report on Friday: “Increased fiscal spending should be a powerful remedy for policy uncertainty and other ills afflicting the euro,” and raised their three-month euro forecast from $1.02 to $1.07.
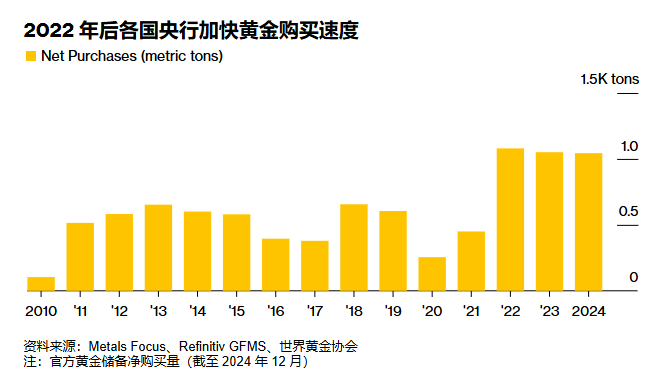
Gold, another major adversary to the competitiveness of the US dollar, has also set a new historical high of over 3,000 US dollars per ounce. This also brings a negative impact on the US dollar.
Gold prices broke through $3,000 an ounce for the first time, driven by a buying frenzy from central banks, global economic fragility and US President Donald Trump’s attempts to rewrite global trade rules by imposing tariffs on allies and strategic rivals.
Gold prices rose by 0.5% to $3,004.94 an ounce at one point on Friday, but later gave up the gains.
Breaking through the psychological threshold of $3,000 has further highlighted gold’s role as a store of value during turbulent times and as an indicator of market panic over the centuries. In the past quarter-century, the price of gold has risen tenfold, even outpacing the benchmark S&P 500 index of the US stock market, which has quadrupled over the same period.
As traders braced for tariffs, the price of gold in the US soared above other international benchmarks, prompting dealers to ship large amounts of the precious metal to the US before the tariffs took effect. From election day to March 12, more than 23 million ounces of gold (worth about $70 billion) flowed into the warehouses of the New York Mercantile Exchange’s Comex division. The inflow was so large that it contributed to the US posting a record trade deficit in January.
Technical analysis:
Gold: Yesterday, our reminder to buy on the pullback after the price broke through was just 4 dollars away from the stop-loss space to perfectly capture the opportunity. Currently, the price has once again broken through the 3000 mark and formed a new demand zone. For today, we suggest maintaining the buying opportunity at the potential demand zone of 2998-3003 on the pullback. For detailed positions, please consult the plugin.
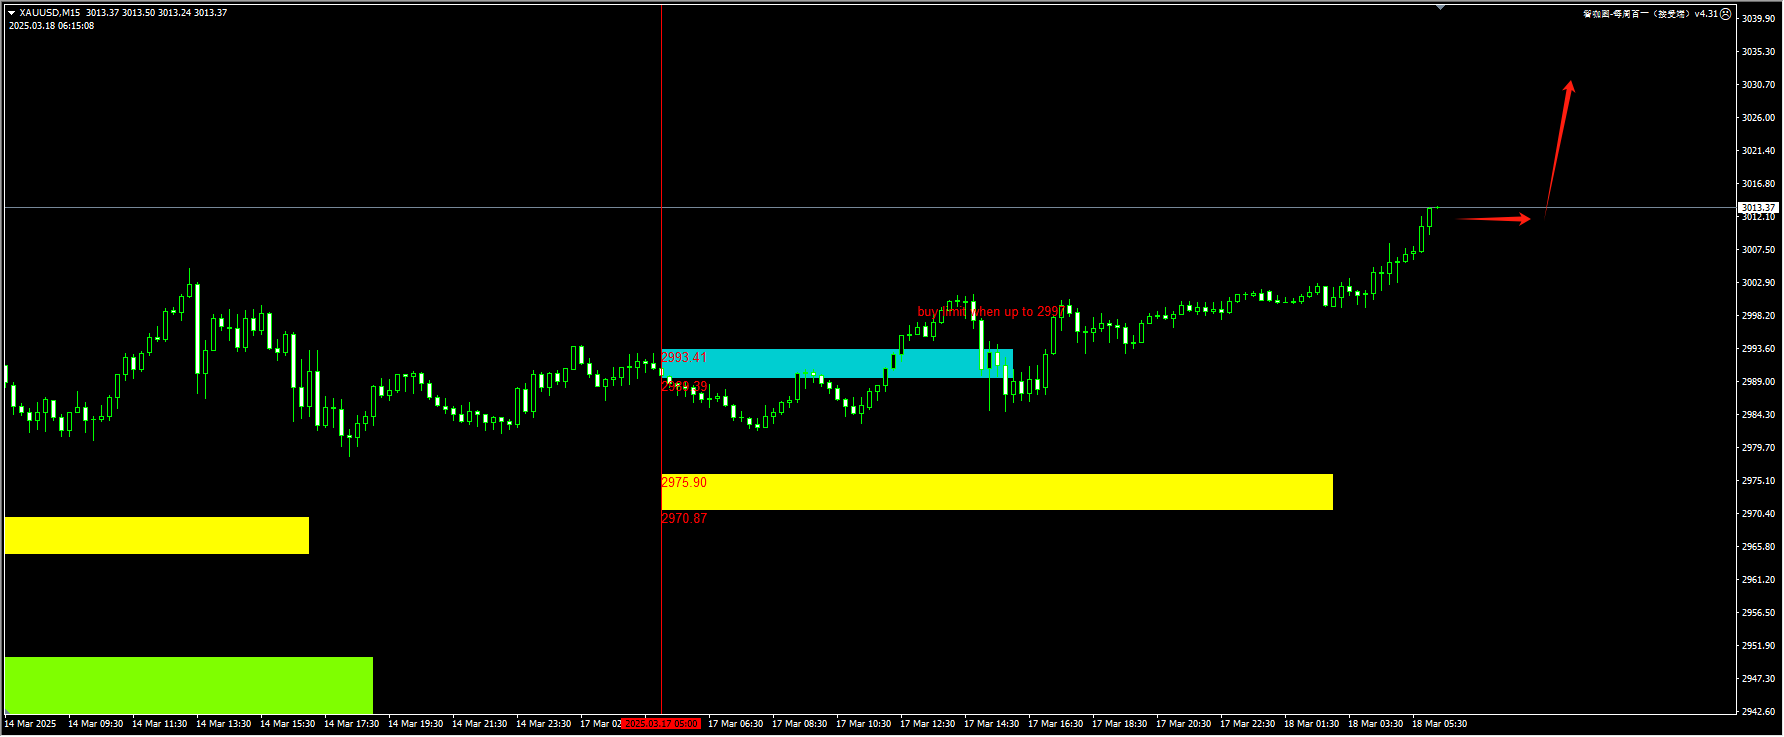
(Gold 15-minute chart)
The plugin is updated from 12:00 to 13:00 every trading day. If you want to experience the same plugin as shown in the chart, please contact V: Hana-fgfg.
Nasdaq: Our previous two consecutive days of arranging the blue breakthrough pullback buy operation achieved a very perfect result. The intraday price has pulled back again. We suggest continuing the previous operation, waiting for the price to break through and recover above 19800, and then look for a new demand area to buy. For detailed positions, please consult the plugin.
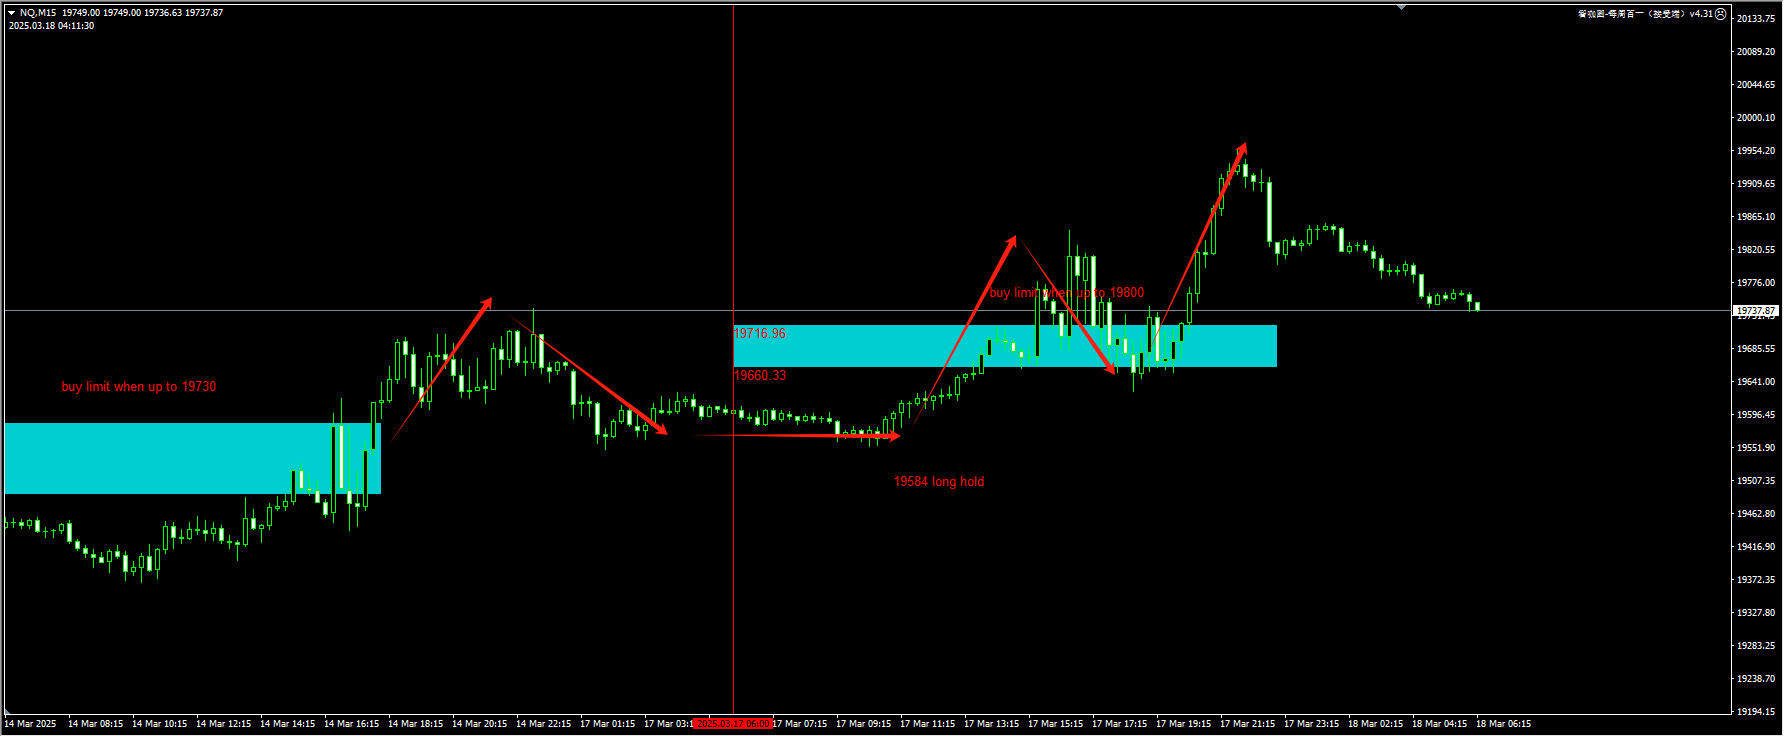
(NASDAQ 15-minute chart)
The plugin is updated from 12:00 to 13:00 every trading day. If you want to experience the same plugin as shown in the chart, please contact V: Hana-fgfg.
Crude oil: Yesterday, the price showed a support effect at 67.50, which led to a rebound to the highest point of 67.88, achieving a 1:1 profit-to-loss ratio. Today, we will continue to monitor whether the previous high can be effectively broken through. If it can, we will actively maintain the buying operation; if not, we will wait for the liquidity in the yellow area to be refreshed before buying. For detailed positions, please consult the plugin.
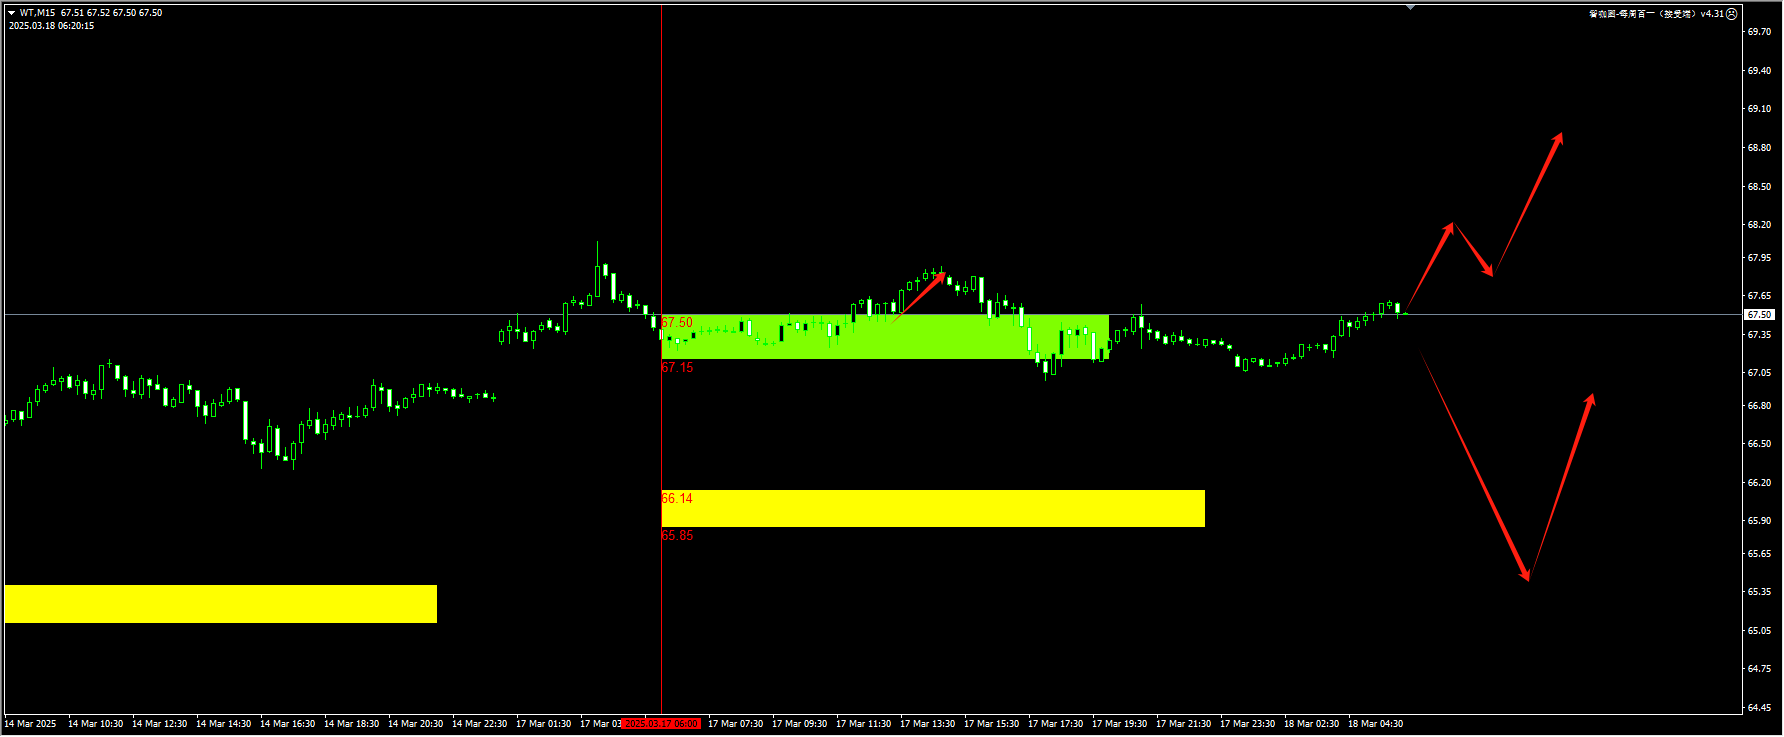
(Crude Oil 15-Minute Chart)
The plugin is updated from 12:00 to 13:00 every trading day. If you want to experience the same plugin as shown in the picture, please contact V:Hana-fgfg.
Today’s key financial data and events to focus on:
18:00 Germany’s March ZEW Economic Sentiment Index
20:30 Canadian Consumer Price Index for February (Year-on-Year)
20:30 US New Housing Starts for February (Annualized Monthly Rate)