The US dollar is set to post its worst performance in more than a year this month as the economic expansion in the United States is threatened by President Donald Trump’s tariff policies.
Due to a miscalculation of tariffs, traders bet on the depreciation of the US dollar, and the Bloomberg Dollar Spot Index has dropped by more than 4% from its intraday high on February 3. This is a sharp contrast to earlier this year when investors initially believed that the Trump administration’s plans would support the world’s reserve currency.
Barclays’ foreign exchange strategist Skylar Montgomery Koning said: “Trump’s policies have negative impacts but no positive ones: the slowdown of US economic data, the fading hope of additional stimulus measures in the US, the capricious tariff policy, and the unexpectedly large-scale response from Europe.”
More and more investors are turning bearish on the US dollar as data shows that the US economy is cooling down while Europe is ramping up spending. The latest data released on Tuesday indicated that US consumer confidence dropped to its lowest level in four years in March.
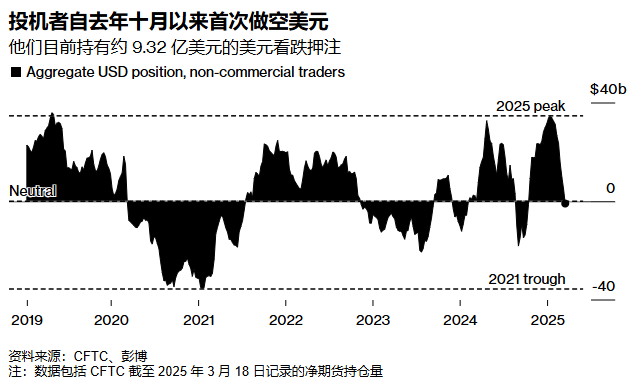
Data from the U.S. Commodity Futures Trading Commission shows that speculative traders were most bullish on the U.S. dollar in mid-January, ahead of the U.S. presidential inauguration, but then turned bearish on the dollar in the week ending March 18.
Bill Campbell, portfolio manager at DoubleLine Capital, said his short-term view on the dollar is neutral but “slightly bearish”. He said that before the inauguration, investors were waiting to see which of Trump’s campaign promises would be fulfilled first, but the president is handling too many things at once, which brings a lot of “execution risk”, Campbell said.
Tim Baker, a macro strategist at Deutsche Bank, said: “At the beginning of this year, the market believed that the upcoming tariffs would be beneficial to the US dollar. But it was US data, not that of other countries, that triggered concerns over tariffs.”
Barclays’ Montgomery Conning said she had lowered her expectations for a stronger dollar before April 2, as the delayed tariffs imposed by the US on Canada and Mexico and other reciprocal tariffs would take effect on April 2. Before this key date, the hedging costs in the currency market had already risen.
Apart from Canada and Mexico, Trump and Treasury Secretary Scott Bessent said they are considering imposing non-tariff taxes and formulating regulatory provisions on the so-called “dirty 15 countries” – a move that will have further implications for the US dollar.
After Trump hinted that some countries would be exempted from reciprocal tariffs next week, countries hit by US tariffs are working to offer concessions or take other measures.
Read more: Trade negotiations heat up as Trump’s April 2 tariff threat looms
Over the past two weeks, the Canadian dollar has been supported by tariff delays and a weakening US dollar. In March, the Mexican peso also appreciated against the US dollar.
Last week, Citigroup’s currency strategists downgraded their dollar forecast for the next six to 12 months, citing the recent sharp decline of the dollar and the possible economic recovery in Europe and China.
Technical analysis:
Gold: There has been a notable change in price and performance compared to last week, with the behavior of liquidity cleaning weakening. We reminded you yesterday to pay attention to the momentum performance in the 3010/15 area. As shown in the chart plugin, after stabilizing in the 3013/17 area, the price has continuously launched rebound attacks. Today, we continue to focus on the opportunity to buy on pullbacks. For detailed positions, please consult the plugin.
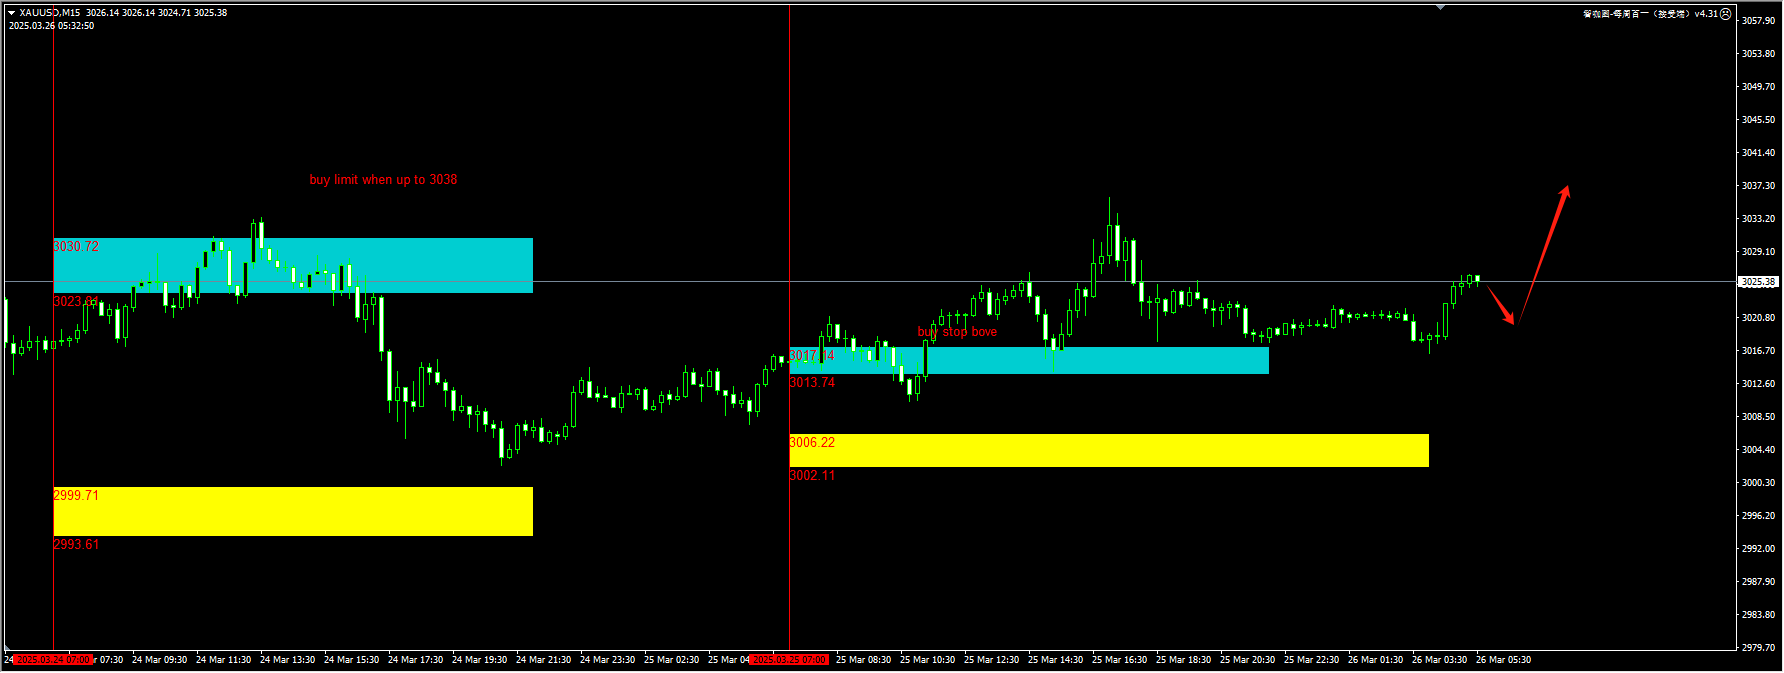
(Gold 15-minute chart)
The plugin is updated from 12:00 to 13:00 every trading day. If you want to experience the same plugin as shown in the chart, please contact V: Hana-fgfg.
The Nasdaq index: The price has continued the rebound trend after stabilizing last week, having recaptured the resistance zone of 20,000 – 20,100 and further advanced. For today, we will be watching for a pullback to the 20,300 – 20,350 range as a potential buying opportunity. For detailed positions, please consult the plugin.
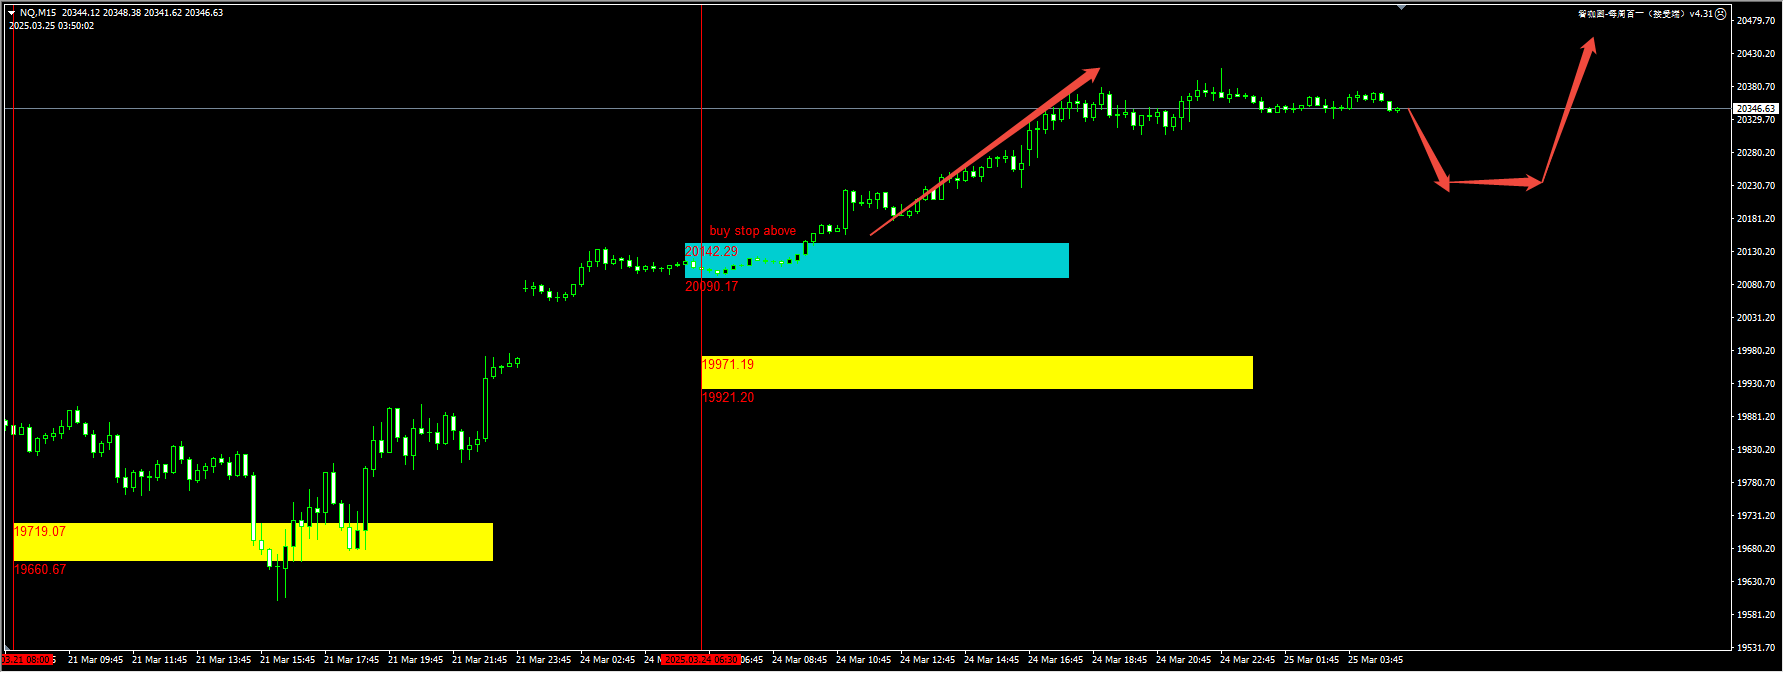
(NASDAQ 15-minute chart)
The plugin is updated from 12:00 to 13:00 every trading day. If you want to experience the same plugin as shown in the chart, please contact V: Hana-fgfg.
Crude oil: The upward trend on the 4-hour chart remains intact, but in the short term, the price may need to consolidate and wait for new momentum to break through. Today, we continue to pay attention to whether a new bullish signal appears at 68.70. For detailed positions, please consult the plugin.
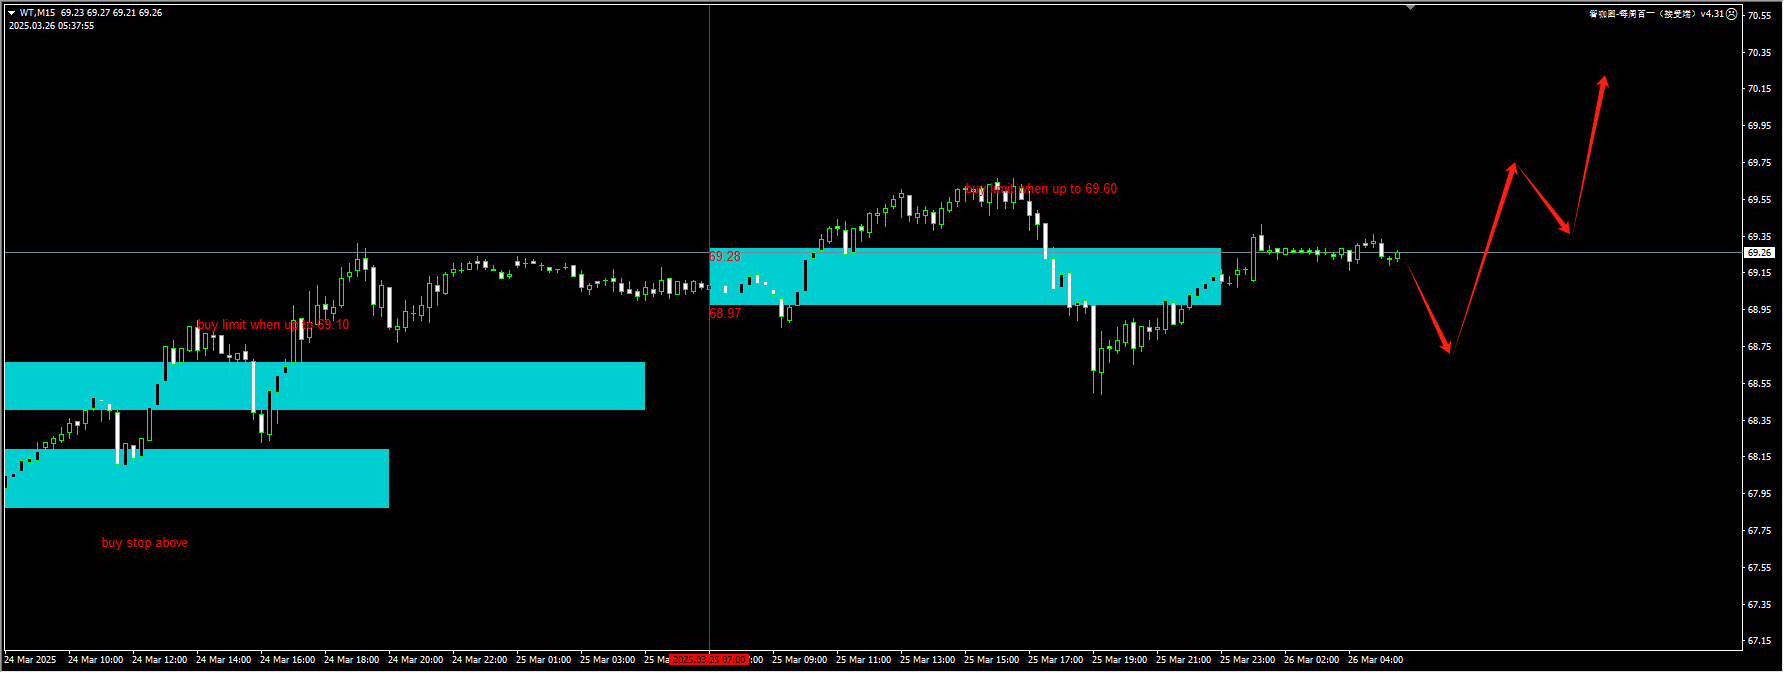
(Crude Oil 15-Minute Chart)
The plugin is updated from 12:00 to 13:00 every trading day. If you want to experience the same plugin as shown in the picture, please contact V:Hana-fgfg.
Today’s key financial data and events to focus on:
15:00 UK Consumer Price Index (Year-on-Year) for February
20:30 US Durable Goods Orders for February (MoM) (Preliminary)