The traditional relationship between the US dollar and US Treasury yields is at its weakest in three years as investors reconsider the safety of US assets during times of stress.
The reason for the rapid decline of the US dollar is that the trade war initiated by the Trump administration may lead to an economic recession, causing investors to withdraw from US assets. Meanwhile, the yield on long-term US bonds remains close to a 17-month high.
Under normal circumstances, a rise in bond yields is beneficial to the US dollar. But this time, as more and more investors question the dollar’s safe-haven status and its core role in the global financial system, the two have diverged. Option positions indicate that traders expect the dollar to fall further.
In a report, Jens Naervig Pedersen, an analyst at Danske Bank, wrote: “The disconnect between the dollar, yields and traditional risk proxies is astonishing and increasingly reminiscent of past stress events.”
The Bloomberg Dollar Spot Index fell last week by the most since November 2022 and continued to decline on Monday. Data from the Depository Trust & Clearing Corporation (DTCC) showed that about two-thirds of the options traded in the past week targeted a weakening of the dollar against the euro, yen and Swiss franc.
Pedersen said that last week was the third time in more than 50 years that the dollar had fallen by more than 2.5% while the 10-year US Treasury yield had risen by at least 25 basis points. The other two times were in July 1985, during the so-called Plaza Accord aimed at devaluing the dollar, and in May 2009. He said that both of these events “led to a sustained weakening of the dollar”.
The options market indicates that traders are positioning themselves for this development. The so-called risk-reversal indicator, a barometer of investor sentiment that measures the premium of selling dollar options over buying them, shows that traders are betting the dollar will weaken over multiple time periods from next week to next year. This is the first time since the beginning of 2020 that all risk-reversal indicators have shown such a trend.
Alvaro Vivanco, the head of strategy at TJM FX, said: “Over the past week, the market has been highly focused on the pressure on US Treasuries and the changing correlation with the US dollar. In the coming weeks and months, selling US assets but avoiding sustained panic might be the right strategy.”
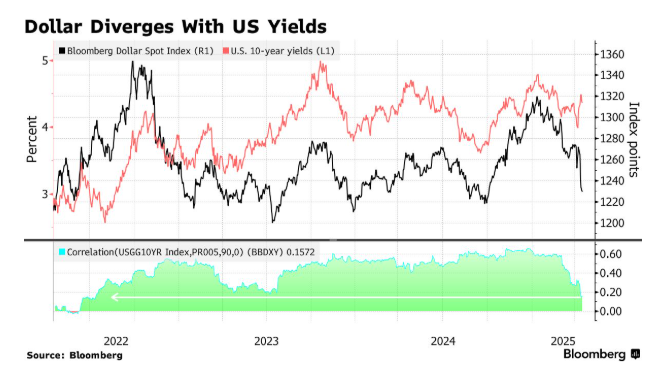
The correlation between the US dollar and yields is currently at its lowest level since Russia’s invasion of Ukraine. Back then, although the dollar was decoupled from the performance of US Treasuries, safe-haven funds still supported the dollar. Now, the situation is exactly the opposite: the dollar is no longer benefiting from its safe-haven status, and this decoupling reflects that investors are accelerating their withdrawal from US assets.
“The sustainability of the US dollar as a reserve currency is increasingly being questioned,” said Alberto Gallo, chief investment officer at Andromeda Capital Management. “This undermines the US brand and also the ability of investors to hold the dollar over the long term.”
Technical analysis:
Gold: Yesterday, the position we arranged for catching the buy stop after the blue momentum breakthrough, after experiencing fluctuations in the offshore market, ultimately achieved a breakthrough movement of nearly 50 dollars. As a result, the gold price continued to set a new historical high above 3270. Today, we will continue to maintain the operation combination of blue momentum breakthrough + yellow sweeping liquidity. For detailed positions, please consult the plugin.
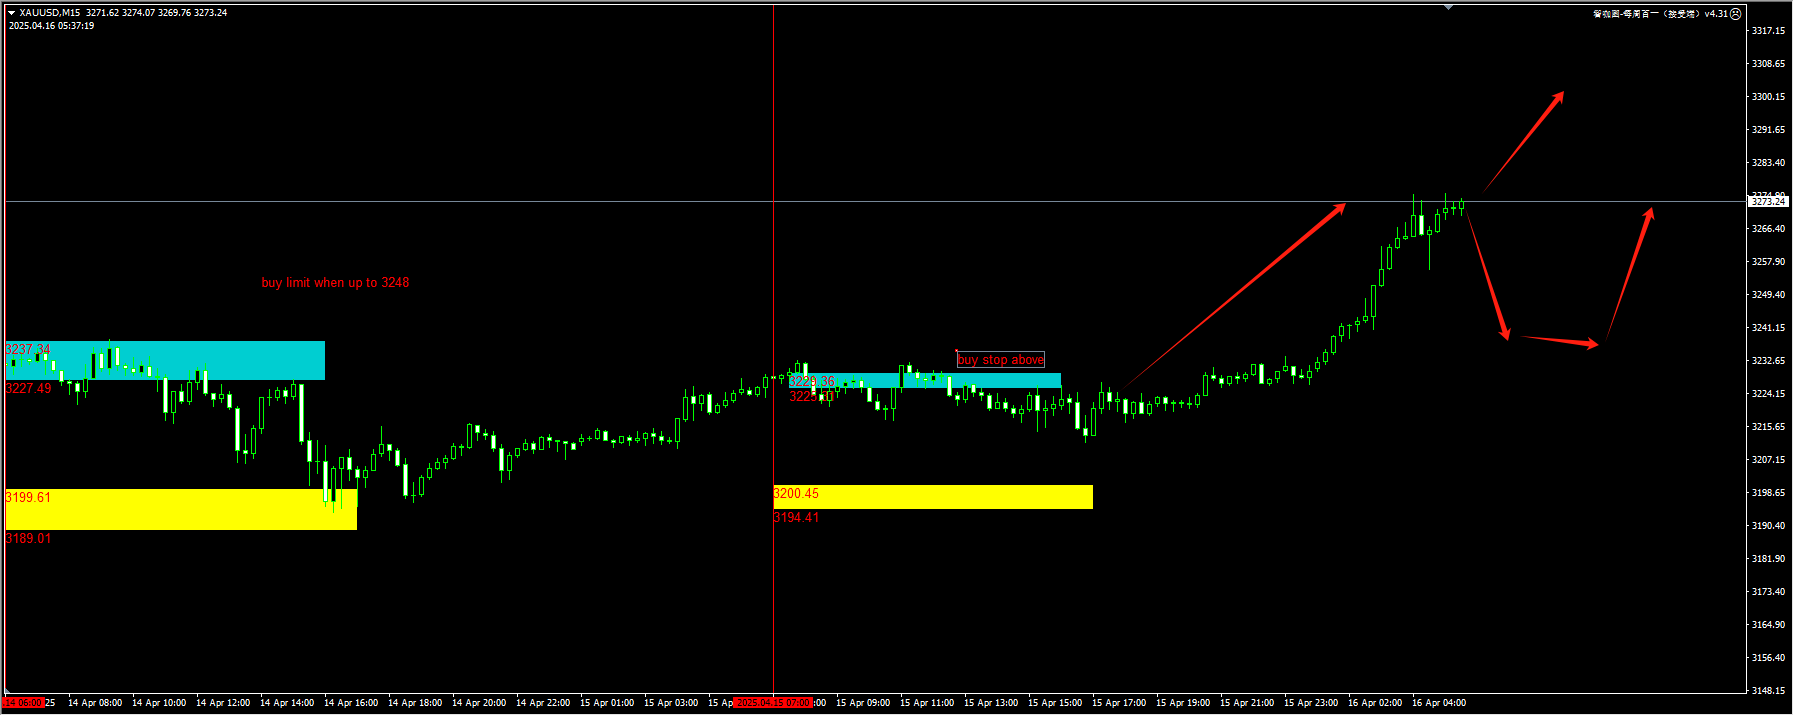
(Gold 15-minute chart)
The plugin is updated from 12:00 to 13:00 every trading day. If you want to experience the same plugin as shown in the chart, please contact V: Hana-fgfg.
The Nasdaq: The price broke through and then retraced near the blue alert position of our plugin, still generating a decent rebound. However, after the market closed, it dropped below the yellow zone due to the drag of technology stocks, sweeping away liquidity. For today, we will continue to monitor the further rebound opportunity after recapturing 18,800. For detailed positions, please consult the plugin.
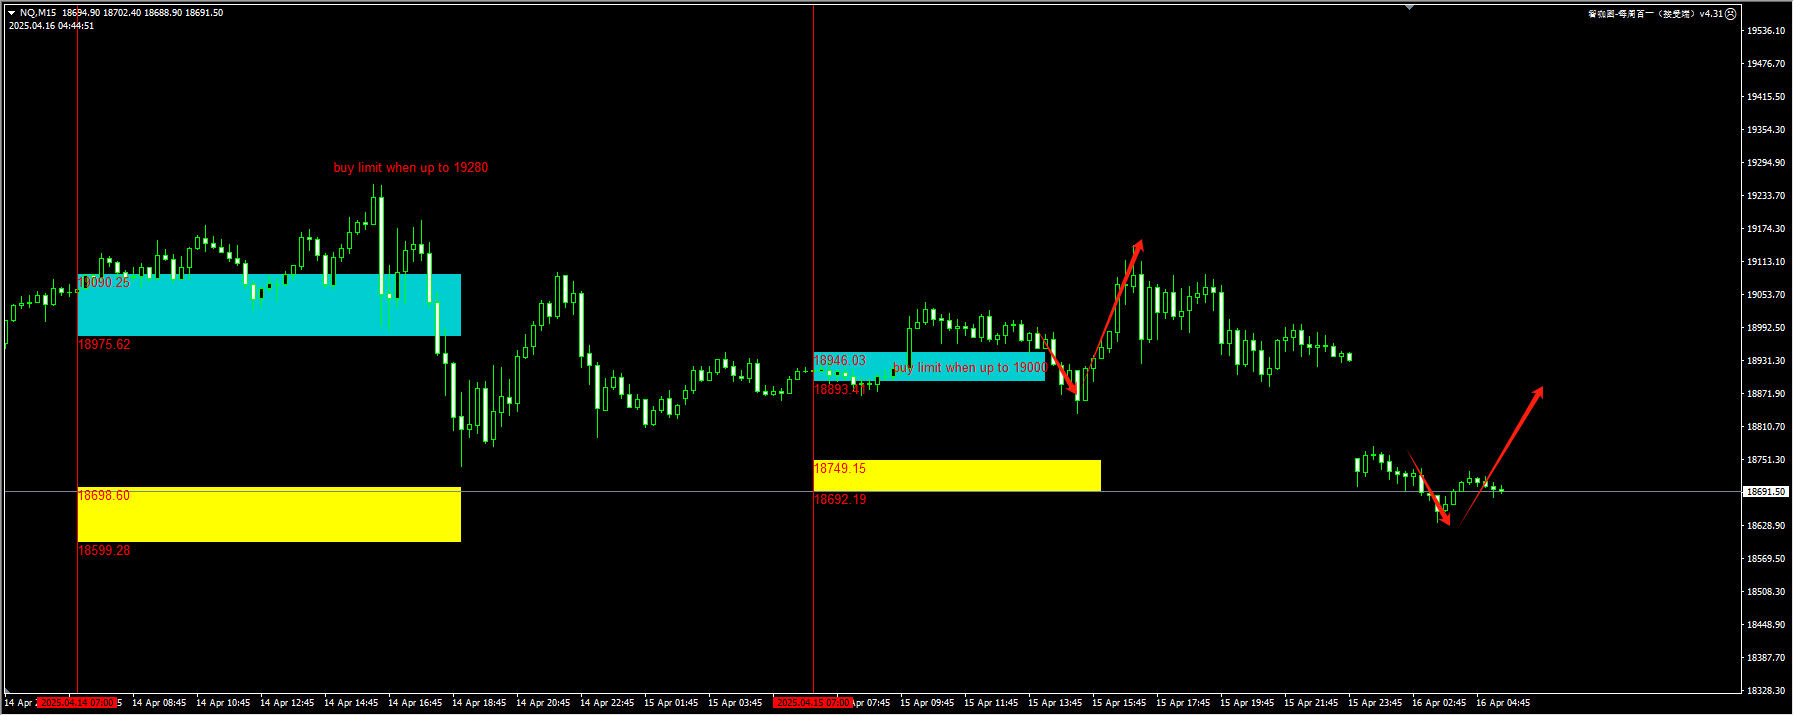
(NASDAQ 15-minute chart)
The plugin is updated from 12:00 to 13:00 every trading day. If you want to experience the same plugin as shown in the chart, please contact V: Hana-fgfg.
Crude oil: Due to Trump’s 90-day suspension of full reciprocal tariffs, the pressure on oil prices from recession concerns has been greatly alleviated. Yesterday, our plugin reminded that in the green area, one should pay attention to the low-buy signal. As shown in the figure, there should be two good opportunities. Within the day, we need a stronger price signal to continue attempting to buy. It is recommended to pay attention to the signal of a breakthrough and a retest for confirmation. For detailed positions, please consult the plugin.
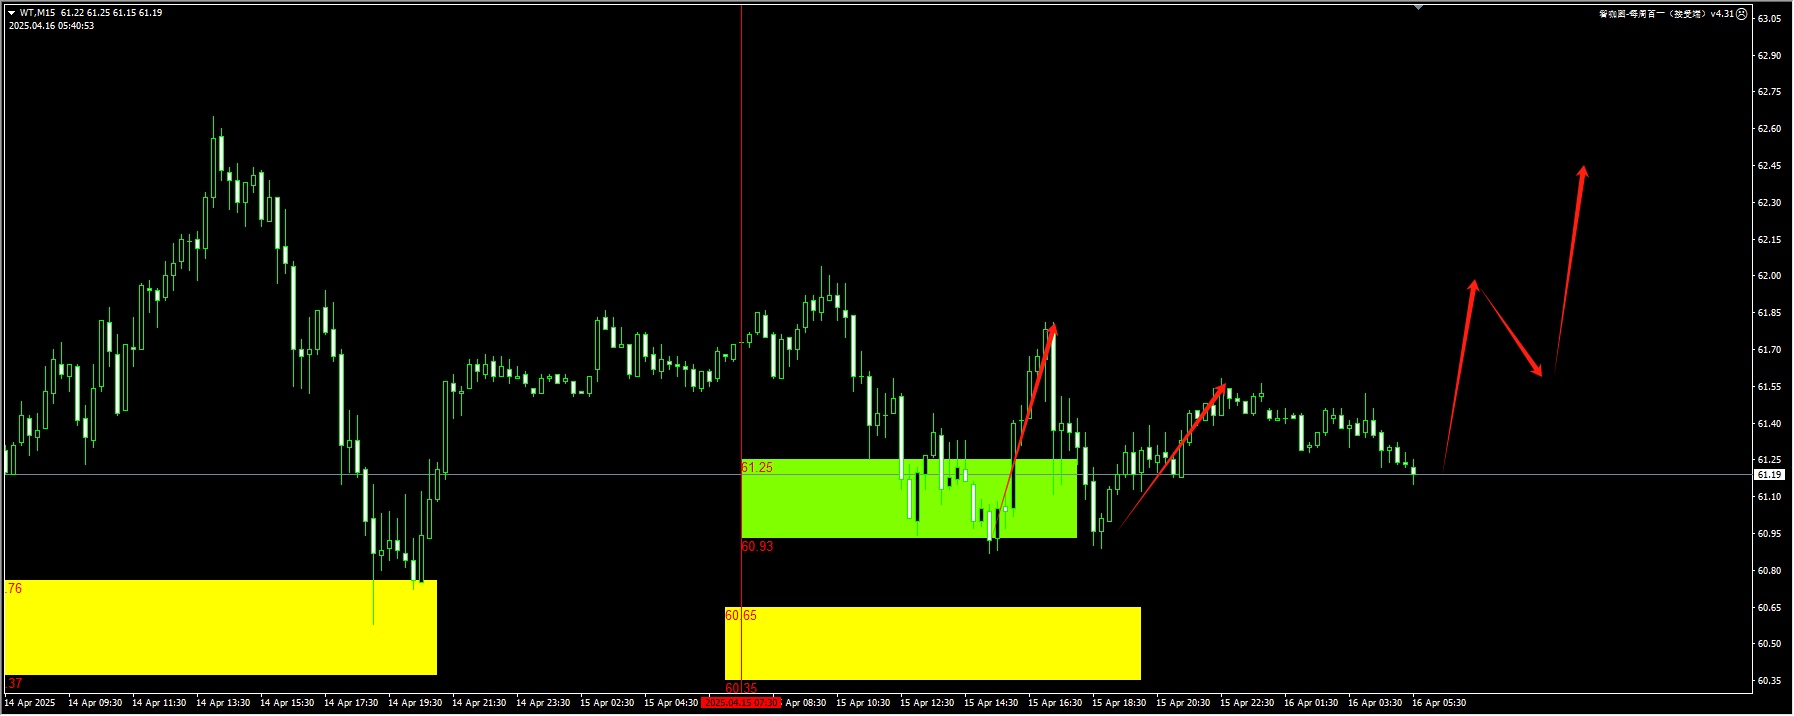
(Crude Oil 15-Minute Chart)
The plugin is updated from 12:00 to 13:00 every trading day. If you want to experience the same plugin as shown in the picture, please contact V:Hana-fgfg.
Today’s key financial data and events to focus on:
14:00 UK March Consumer Price Index (Year-on-Year)
17:00 Eurozone March consumer price index final reading (year-on-year)
20:30 US March Retail Sales (MoM)
21:15 US Industrial Production for March (MoM)
21:45 Canadian overnight target rate
At 22:30, the Governor of the Bank of Canada, Macklem, will hold a press conference on monetary policy.