A new study released by Morgan Stanley shows that investors hoping to profit from a “Goldilocks” environment of rising US stocks but limited losses in the Treasury market should short the US dollar.
This scenario for US assets is one of eight scenarios analyzed by the bank when conducting a historical review of the correlation between the US dollar and the daily returns of the S&P 500 index and the benchmark 10-year US Treasury bond.
Earlier this year, the performance of the US dollar against other assets came into focus when it fell in tandem with the stock market, marking a departure from its traditional safe-haven status. Since then, the traditional negative correlation between the dollar and the stock market has been restored: at the beginning of this month, despite the sharp fluctuations in the dollar’s exchange rate, the S&P 500 index soared to a new high.
In a report on October 20, the Morgan Stanley team (including Molly Nikolin and Andrew Watrous) stated: “The correlation between the US dollar and risk and interest rates has changed over time. Identifying repeatable setups can allow investors to recognize patterns in the macro cycle.”
From a longer-term perspective, Morgan Stanley has identified a clear pattern over the past 25 years that aligns more closely with the common perception that the US dollar falls when the stock market rises and vice versa.
Morgan Stanley’s analysis shows that selling the US dollar against the British pound is the best-performing trade within six months after the US stock market rises by 1.25 standard deviations or more (while the downside “sigma” values of the US dollar and the 10-year Treasury yield are below 1.25).
Another market formation studied by Nickolin and his team is when the S&P 500 index, the US dollar and the US Treasury bond yield all rise by more than 1.25 standard deviations. Morgan Stanley said this is called an “all-in” signal, symbolizing a risky environment and also a good time to sell the US dollar and buy the Australian dollar.
Technical analysis:
The WeChat functions may be restricted from time to time. If you want to experience the plugin, please leave your contact information when adding a friend so that we can add you back easily!!!
Gold: Yesterday, our plugin alerted us with a blue signal. After the momentum broke through 4280, we attempted to place a buy limit order but missed by 1 dollar. However, from the price movement, we can see that the direction and the rhythm of the pullback are exactly as we predicted. Today, we will continue to monitor the 4300/4320 area for a rebound signal after the price fluctuates. Of course, if there is no pullback and the price continues to break through the 4360/80 area, we should also consider taking a long position, but the position size should be controlled. For detailed positions, please consult the plugin.
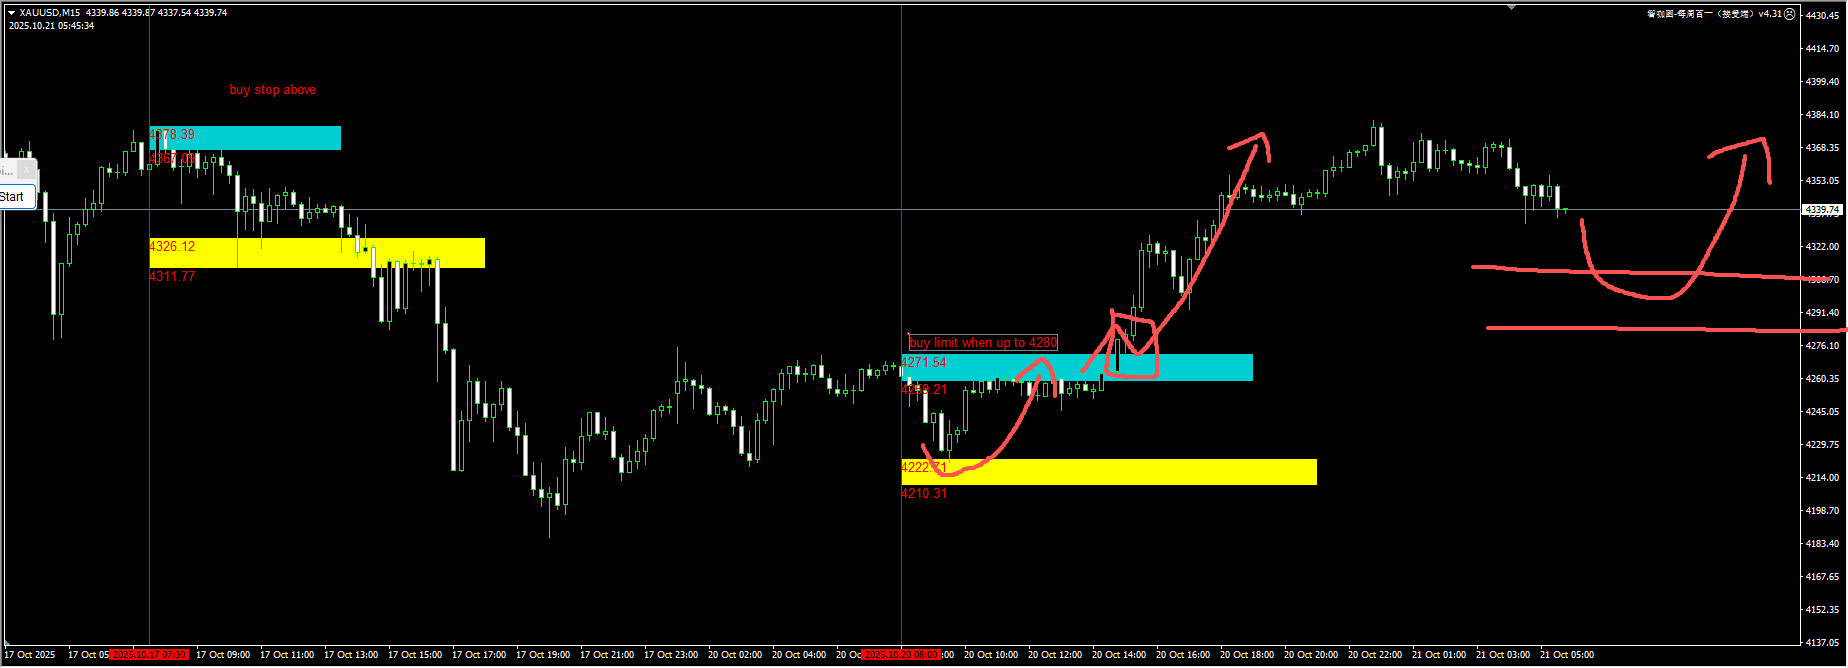
(Gold 15-minute chart)
The plugin is updated from 12:00 to 13:00 every trading day. If you want to experience the same plugin as shown in the chart, please contact V: Hana-fgfg and leave your contact information for us to get back to you.
Nasdaq: The pullback to the yellow zone we hoped for yesterday before going long did not occur. Today, we will closely monitor the pullback near the 25,000 level and set up a green + yellow operation combination around that level. For the exact positions, please consult the plugin.
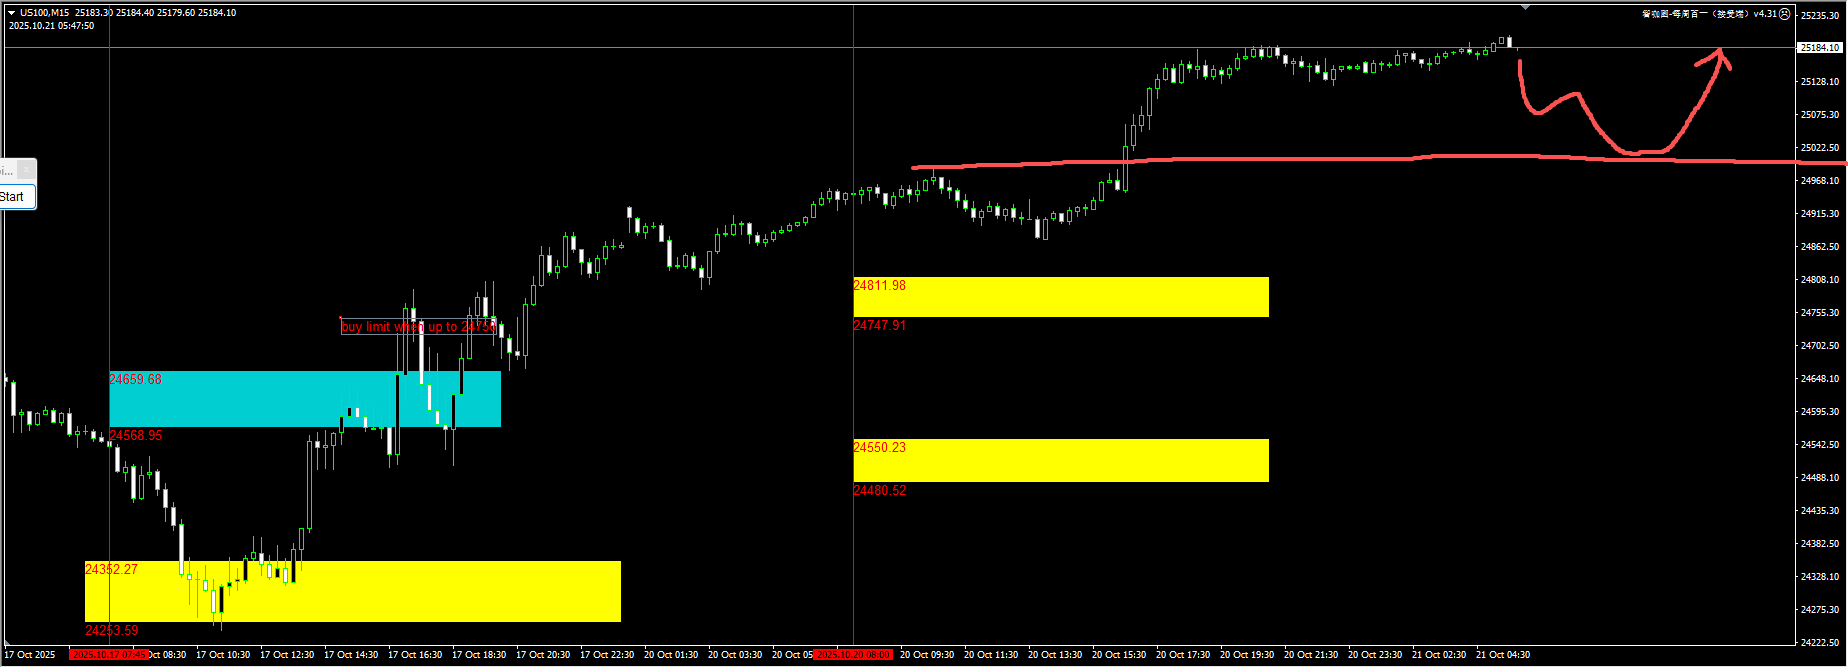
(NASDAQ 15-minute chart)
The plugin is updated from 12:00 to 13:00 every trading day. If you want to experience the same plugin as shown in the chart, please contact V: Hana-fgfg and leave your contact information in the message for us to get back to you.
Crude oil: The yellow strategy we provided through the plugin yesterday (buy stop at the upper edge when the price breaks below the lower edge of the yellow zone) achieved a profit-to-loss ratio of more than 1:1. For today’s trading, continue to follow the operation within the blue zone as per yesterday. For detailed positions, please consult the plugin.
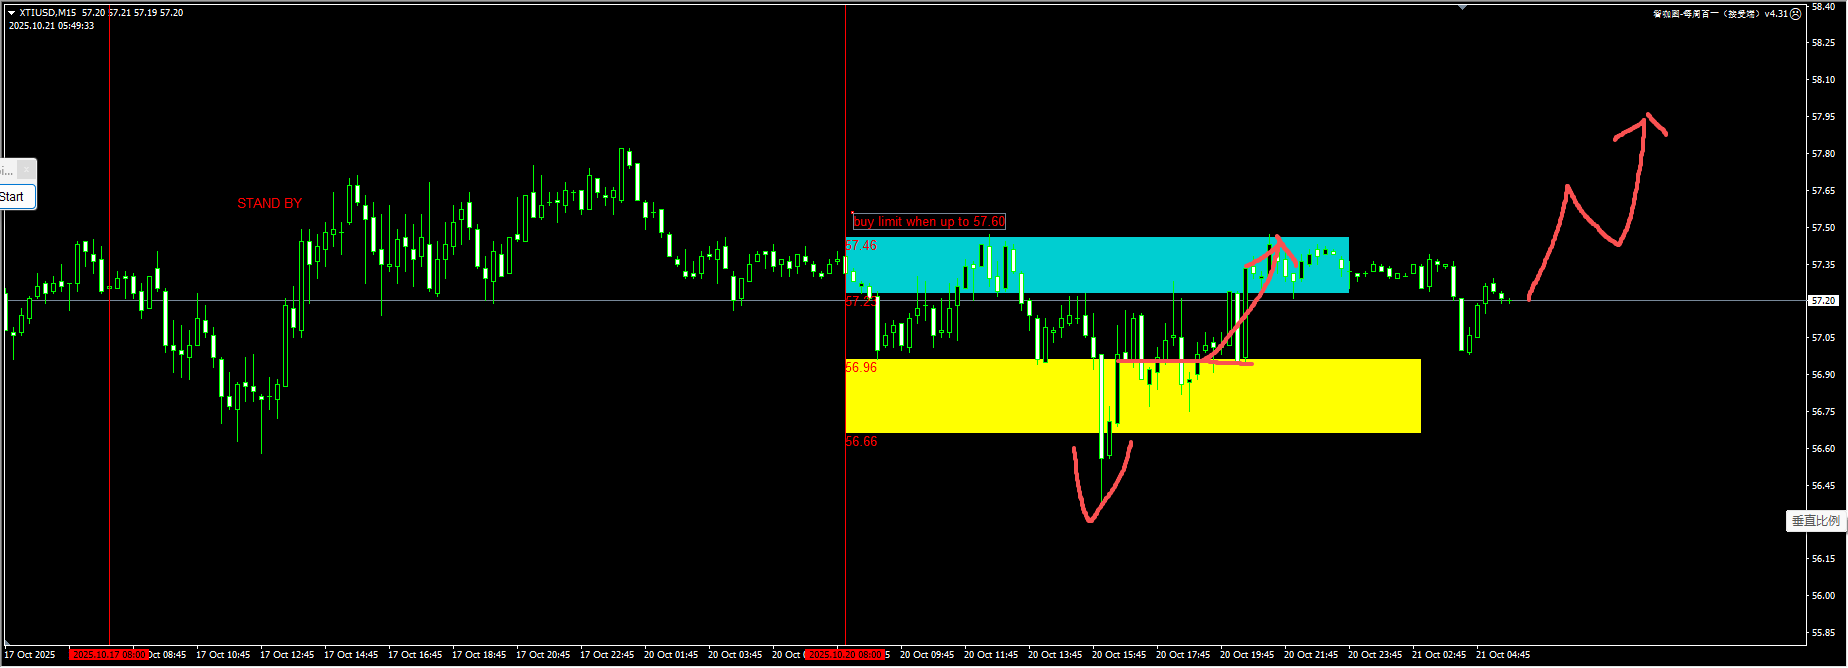
(Crude Oil 15-Minute Chart)
The plugin is updated from 12:00 to 13:00 every trading day. If you want to experience the same plugin as shown in the picture, please contact V: Hana-fgfg and leave your contact information in the message for us to get back to you.