Royal Bank of Canada Capital Markets said that once the factors supporting the US dollar turn into resistance, traders should be on guard against a possible long-term sell-off of the dollar, as this could recreate the boom-and-bust cycle of the dot-com bubble.
The US dollar has taken a beating this year due to the uncertainty brought about by President Trump’s policies. However, the soaring stock market and the allocation of US assets by global investors, with the large-scale passive investment funds being the most important, have provided support for the dollar.
Richard Cochinos, a currency strategist at Royal Bank of Canada, said that over the past two decades, these global players have favored increasingly expensive US assets, especially stocks, and the capital flows have in turn been beneficial to the US dollar.
Kochinos wrote in a report: “This concentrated investment strategy has worked well over the past 15 years, but it poses risks in the current environment. Significant changes in demand (and relative performance) could have a profound impact on the foreign exchange market.”
He wrote that once capital is dispersed from the shock (as happened after the bursting of the Internet bubble in 2000), it signals a significant decline in the US dollar – similar to the 40% drop from peak to trough that the dollar experienced from 2001 to 2008.
Kochinos also listed the challenges that the US dollar will face in the coming years, such as high valuation, changing trade patterns and evolving safe havens, and pointed out that “as we enter 2026, long-term tail risk management should be our top concern.”
To hedge against the long-term depreciation risk of the US dollar, Royal Bank of Canada suggests that traders adopt a series of strategies, including synthetic call options on the ICE US Dollar Index and call binary options on the euro and the Japanese yen.
RBC’s analysis also highlights the differences between the current environment and that of the 2000s, especially considering the rise of illiquid assets and private asset investment, which could exacerbate financial market volatility during periods of market stress.
Kochinos wrote: “The historical experience after 2000 provides valuable guidance, but the unique combination of technological change, geopolitical tensions and monetary policy experiments today requires some adjustments, as the allocation framework is no longer traditional.”
Technical analysis:
The WeChat functions may be restricted from time to time. If you want to experience the plugin, please leave your contact information when adding a friend so that we can add you back easily!!!
Gold: The price has recovered to the 3960/80 range, but it is currently in a consolidation phase without a clear upward breakout signal. The main strategy for the day is to buy at the lower end of the consolidation range. If the price breaks out without a pullback, you can consider reducing your position and attempting to follow the trend, but the target should be viewed with caution, first aiming for the 4000 mark. For detailed positions, please consult the plugin.

(Gold 15-minute chart)
The plugin is updated from 12:00 to 13:00 every trading day. If you want to experience the same plugin as shown in the chart, please contact V: Hana-fgfg and leave your contact information for us to get back to you.
The Nasdaq: The impact of the Fed’s reduced expectation of a rate cut in December has ultimately exerted downward pressure on the Nasdaq. However, we do not believe that the price will experience a continuous and significant decline for the time being. We will prioritize observing the support performance in the 25,200/25,400 range. There may be signs of a rebound within the day, but after the rebound, it may consolidate for a period of time. At the same time, multiple sweeps of liquidity cannot be ruled out. We will keep an eye on this within the day. For detailed positions, please consult the plugin.
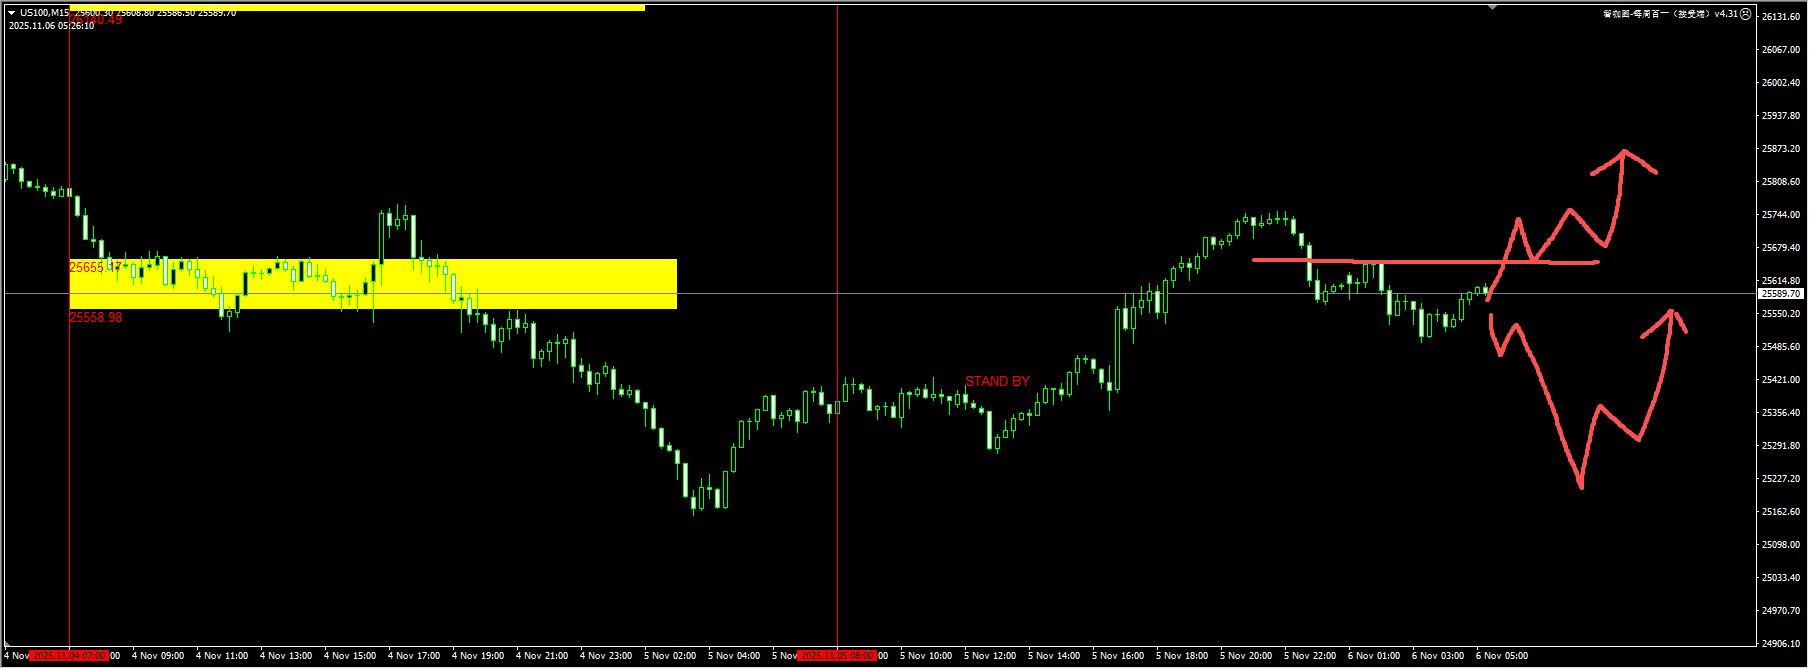
(NASDAQ 15-minute chart)
The plugin is updated from 12:00 to 13:00 every trading day. If you want to experience the same plugin as shown in the chart, please contact V: Hana-fgfg and leave your contact information in the message for us to get back to you.
Crude oil: The green buy limit operation prompted by the plugin yesterday won a profit-to-loss ratio of over 1.5 times. However, the price gradually declined afterwards and broke through the support of the green demand zone. We suggest observing for a day today. For detailed positions, please consult the plugin.
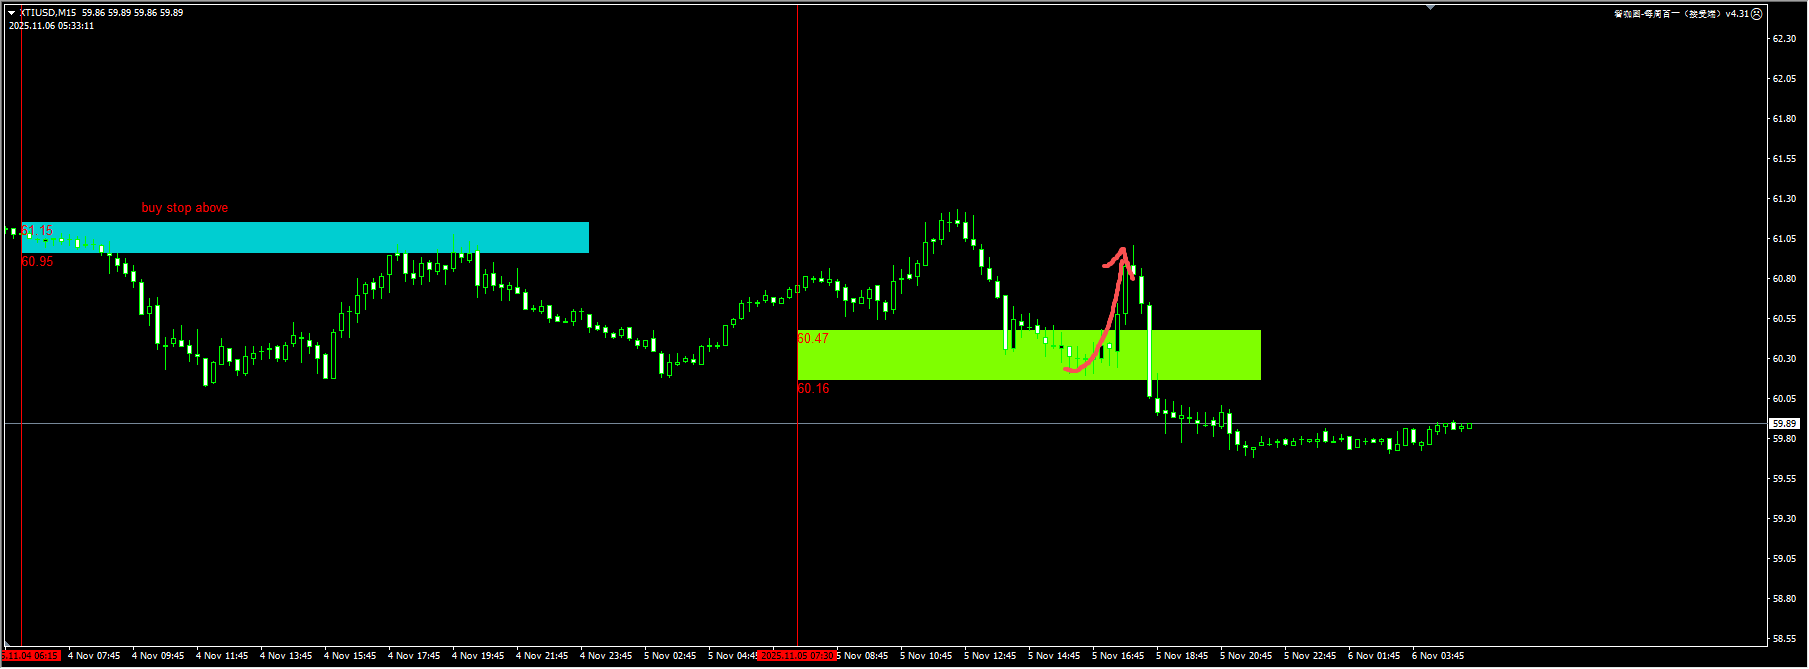
(Crude Oil 15-Minute Chart)
The plugin is updated from 12:00 to 13:00 every trading day. If you want to experience the same plugin as shown in the picture, please contact V: Hana-fgfg and leave your contact information in the message for us to get back to you.
Key economic data and events to focus on today:
18:00 Eurozone retail sales for September
20:00 UK Central Bank Interest Rate Decision to November 6th
20:30 U.S. Challenger Job Cuts in October (in 10,000s)