The longest government shutdown in U.S. history has led foreign exchange traders to face their worst year in decades, and the lack of economic data has also cast a shadow over the outlook for the dollar.
According to the index of BarclayHedge, foreign exchange investors are on track for their worst annual performance since 2005. Before the data gap emerged, Wall Street had already felt the pressure, with companies such as Goldman Sachs, Morgan Stanley and BNY Mellon all reporting declines in foreign exchange trading revenue last quarter.
Due to the federal government shutdown, key economic and market positioning statistics have not been released for weeks, including the crucial monthly U.S. employment market data that was scheduled to be announced on Friday. This has led traders to be reluctant to make big bets on the dollar’s direction, computer-driven quantitative funds lack high-quality data support, and strategists have also postponed the time to update their forecasts.
As a result, foreign exchange volatility has been far below the long-term average – a far cry from the sharp fluctuations that followed US President Donald Trump’s announcement of global tariffs in April.
“For foreign exchange investors, this year will be a bad one overall,” Sean Osborne, chief currency strategist at Bank of Nova Scotia, wrote this week, citing the Barclays Hedge Index, which tracks currency programs in 25 traded foreign exchange futures and cash forward contracts.
He added: “If weak returns persist, traders may be even less willing to increase their risk exposure, so the overall weak returns this year could have an impact on the market in the coming months.”
The absence of key data has made things worse for foreign exchange traders, who have already gone through a challenging period. Amid the chaos caused by tariffs, some long-standing correlations have been broken, and the market has been more influenced by hard-to-track capital flows and changes in hedging strategies.
This has led many investors to reduce their holdings and adopt a more cautious attitude. Indicators measuring confidence in the future direction of the euro/dollar, the world’s most traded currency pair, show that the pair’s annual movement is close to a historical low.
Private data sources, such as proprietary labor mobility indicators, as well as indicators from institutions like ADP Research and ISM, are playing an increasingly important role. For instance, the weak data on the US private sector job market released this week put pressure on the Bloomberg Dollar Index and US Treasury yields. Meanwhile, the consumer confidence index has dropped to a level close to its historical low.
Sharon Yeshaya, the chief financial officer of Morgan Stanley, pointed out during a conference call with analysts on October 15 that foreign exchange trading slowed down in the last quarter. Goldman Sachs’ quarterly report indicated that its net currency income was “significantly lower” than that in the third quarter of 2024. Bank of New York’s foreign exchange income in the third quarter decreased by 5% year-on-year.
Technical analysis:
The WeChat functions may be restricted from time to time. If you want to experience the plugin, please leave your contact information when adding a friend so that we can add you back easily!!!
Gold: The green buy limit area we pointed out last Friday performed strongly, achieving a profit-to-loss ratio of nearly 6:1. As the price has recaptured the key area of 4020/40, the intraday strategy will be more inclined towards positive buy signals. Both buying on a pullback to 4020/40 and chasing the long position on a breakout will be considered. For detailed positions, please consult the plugin.
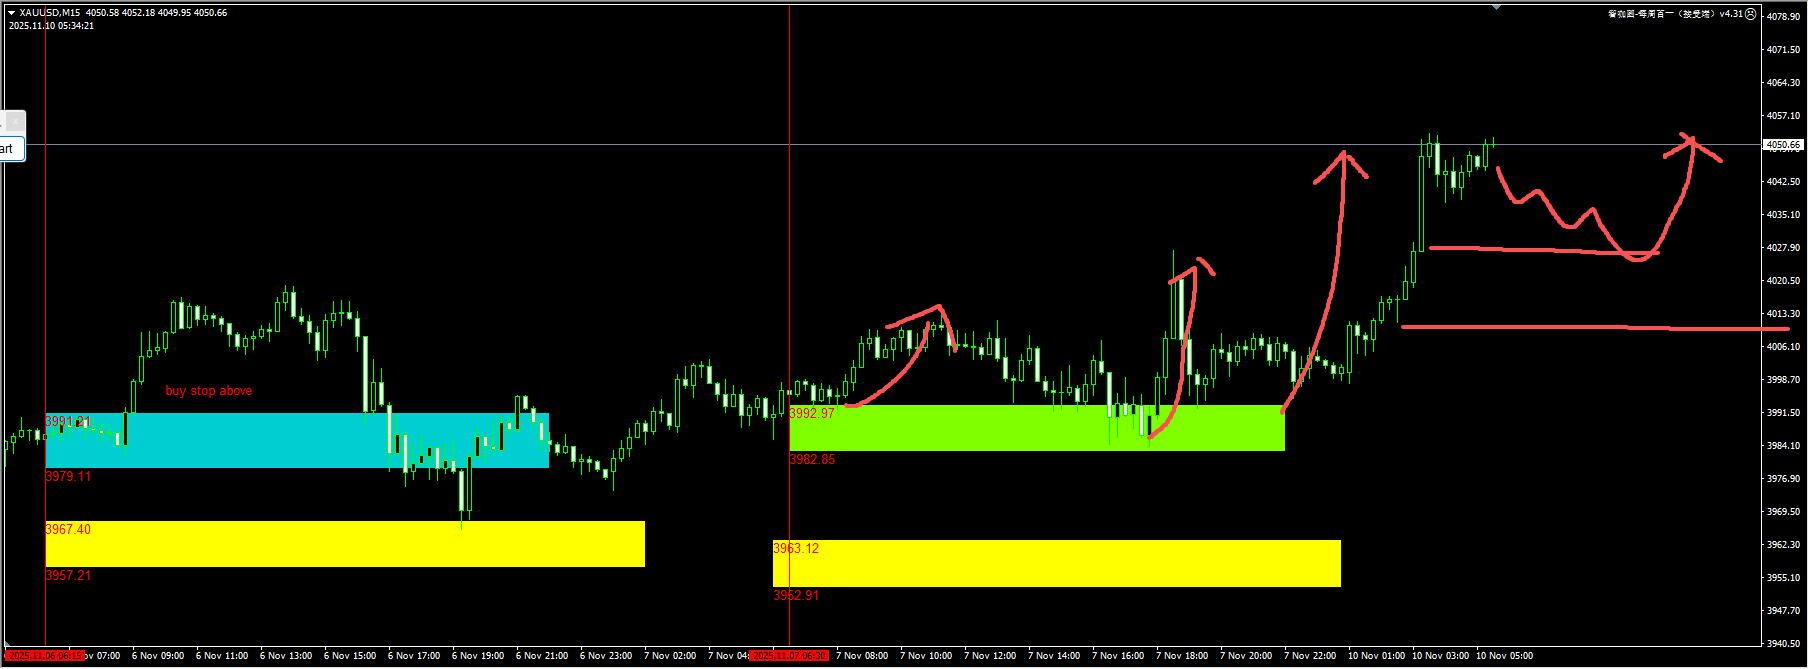
(Gold 15-minute chart)
The plugin is updated from 12:00 to 13:00 every trading day. If you want to experience the same plugin as shown in the chart, please contact V: Hana-fgfg and leave your contact information for us to get back to you.
The Nasdaq index: Over the past week, the price has undergone a correction of around 1,600 points, with short-term negative factors being released. Although we still reserve the option of low-sweeping for liquidity within the day, we need to closely monitor the stabilization signals near 25,000/25,100. For detailed positions, please consult the plugin.
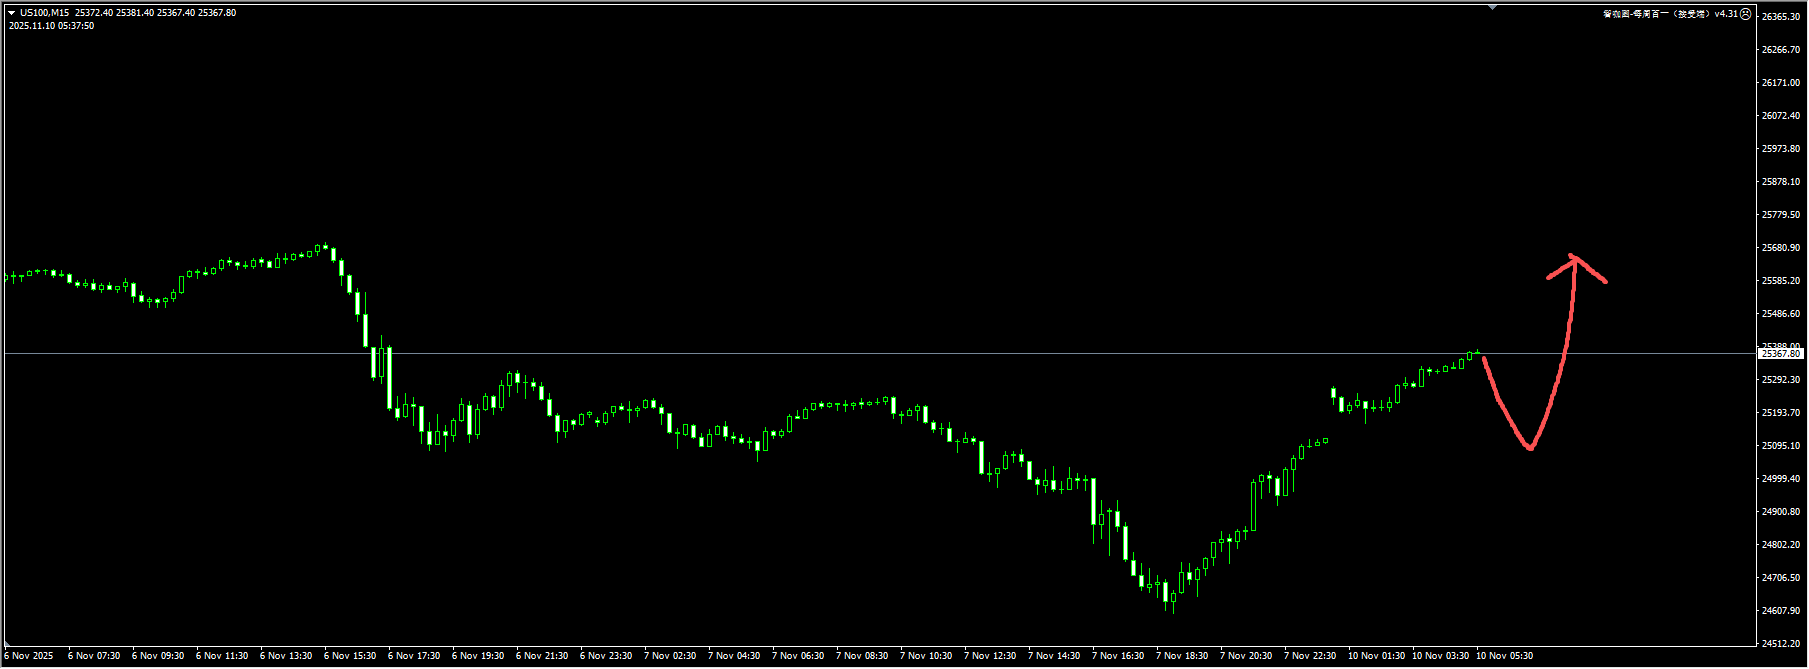
(NASDAQ 15-minute chart)
The plugin is updated from 12:00 to 13:00 every trading day. If you want to experience the same plugin as shown in the chart, please contact V: Hana-fgfg and leave your contact information in the message for us to get back to you.
Crude oil: The buy limit suggested in the green area last Friday was off by 0.16 and we were unable to enter the market. For today, we recommend waiting for a completion signal of a breakthrough and pullback before confirming and executing a long position. For detailed positions, please consult the plugin.
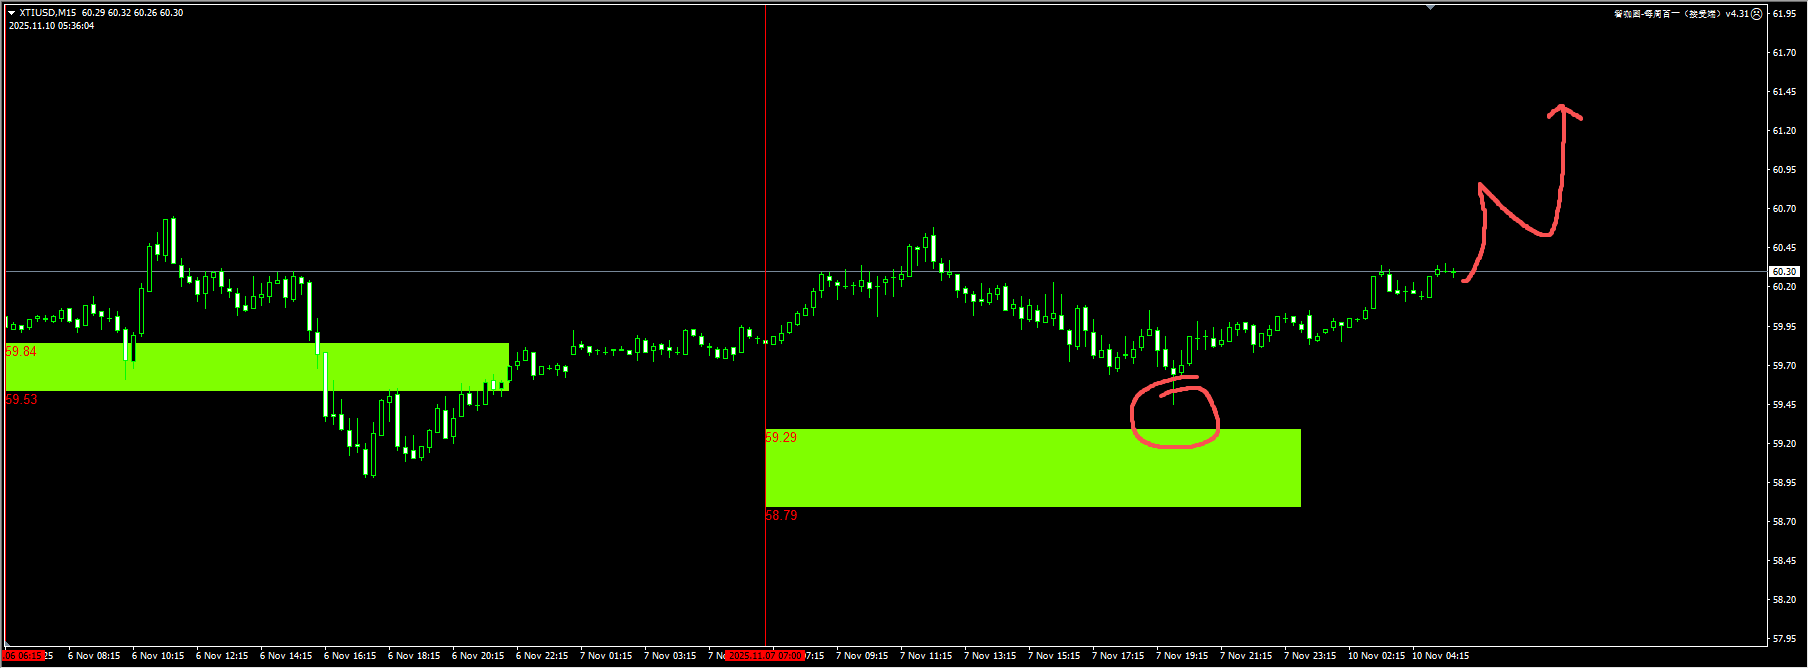
(Crude Oil 15-Minute Chart)
The plugin is updated from 12:00 to 13:00 every trading day. If you want to experience the same plugin as shown in the picture, please contact V: Hana-fgfg and leave your contact information in the message for us to get back to you.