The negative correlation between the US dollar and the US stock market has reached its highest level in nearly a year, once again confirming the typical relationship between assets related to the dollar’s safe-haven status.
Since the outbreak of war in the Middle East at the end of last month, the Bloomberg Dollar Index has risen by nearly 2%, while the S&P 500 Index has dropped by more than 2%. This has caused one of the indicators measuring their short-term correlation to fall to its lowest negative value since the beginning of 2025.
Strategists believe that the relationship between the dollar’s movement and the soaring crude oil price is a key factor. The soaring crude oil price has greatly benefited the United States, the world’s largest oil producer. If this trend continues, the dollar will become an important tool for traders to hedge the risks of their portfolio assets – a role that the dollar has struggled to play in recent months.
Andrew Sheets, Morgan Stanley’s G10 currency strategist, said, “For some well-funded investors, the most important factor is correlation.” Over the past two weeks, “there has been a very clear negative correlation between the dollar and stocks.”
For many years, the dollar’s movement has often been in an inverse relationship with the US stock market. When investors’ demand for risky assets declines, they flock to the dollar; the opposite is also true. But this relationship reversed last year. In April, President Trump’s comprehensive tariff policy triggered a wave of selling of US assets, causing the dollar to post its worst first-half performance since the 1970s.
A key reason for this correlation is the United States’ status as the world’s largest oil producer and the role of the US dollar as the global currency for crude oil trade. The increase of over 40% in the price of West Texas Intermediate crude oil has boosted demand for the US dollar.
Morgan Stanley’s Watros said, “Among the G10 currencies, the US dollar is the only one that is both a safe-haven currency and linked to energy-exporting economies. A stronger dollar is well-deserved.”
Bob Savage, the head of macro strategy at BNY Mellon Markets, said in a note to clients on Monday that the dollar has been boosted by the repatriation of funds by US investors to the domestic market amid geopolitical uncertainties, in addition to the soaring energy costs.
Of course, it is hard to say how long the dollar’s safe-haven status can last – especially when oil prices soar and then fall rapidly, and investors once again focus on tariffs, US fiscal issues and other factors that initially made them bearish on the dollar. Meanwhile, another possible scenario is that the conflict drags on, leading to persistently high oil prices, harming US economic growth and ultimately weakening the dollar.
Audrey Childe-Freeman and Tien Nguyen, strategists at Bloomberg Intelligence, wrote: “The price action has fully demonstrated the strengthening of the US dollar. But it is difficult to assess how much of this is driven by short covering flows and how much marks the beginning of a new sustainable uptrend.”
Technical analysis:
The WeChat functions may be restricted from time to time. If you want to experience the plugin, please leave your contact information when adding a friend so that we can add you back easily!!!
Gold: Yesterday, the two opportunities we alerted through the plugin, the green buy limit and the yellow breakout after the liquidity sweep, both achieved their intended effects. Currently, in the early Asian session, the price has rebounded from below the overnight low of 4980 to around 5010. We suggest focusing on short-term long positions for momentum breakouts within this period, and wait for the volatility brought by the Federal Reserve meeting tonight. For those who have already entered long positions, it is advisable to reduce positions and take protective measures. For detailed positions, please consult the plugin.
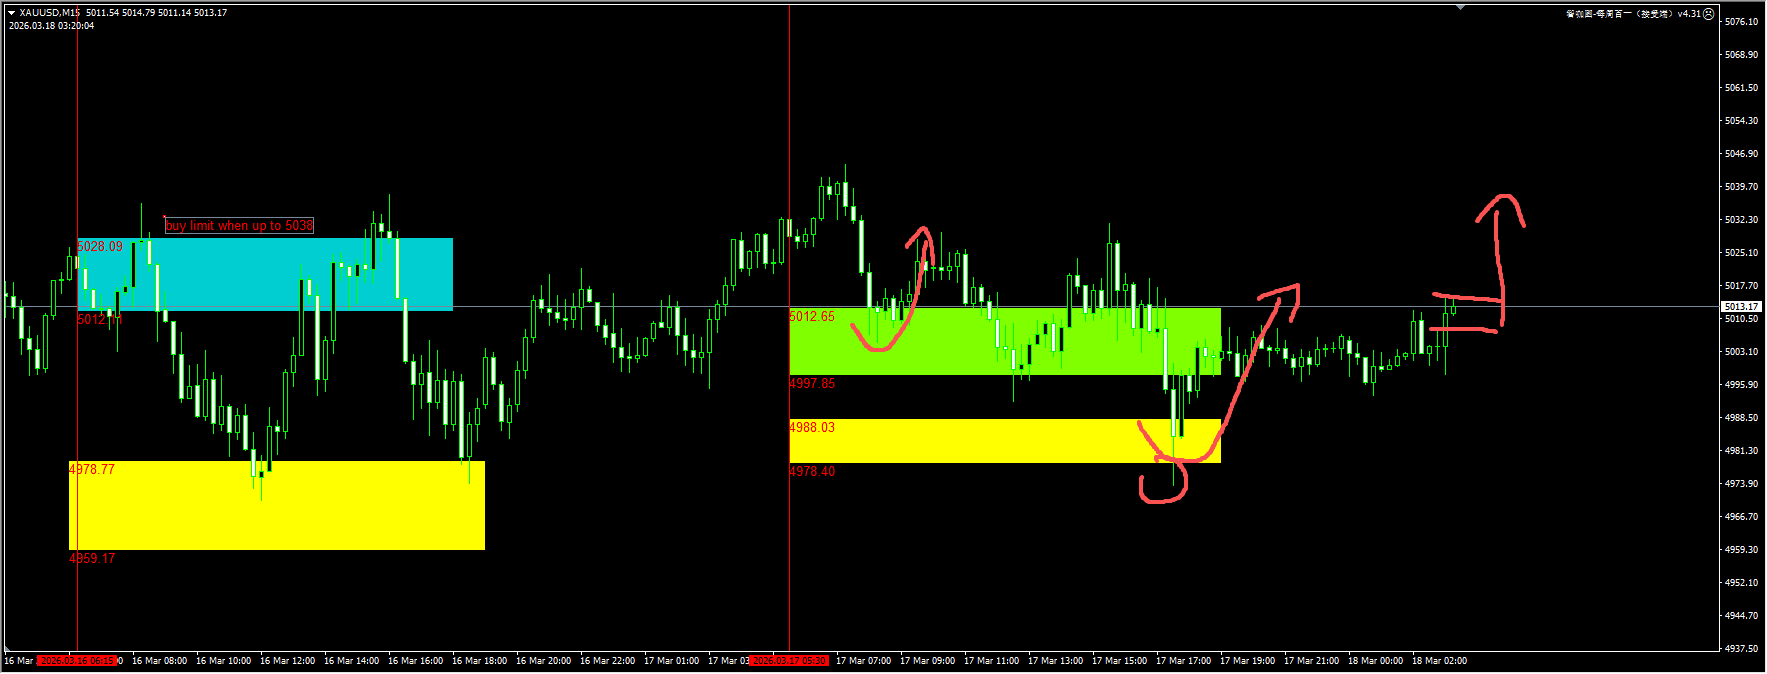
(Gold 15-minute chart)
The plugin is updated from 12:00 to 13:00 every trading day. If you want to experience the same plugin as shown in the chart, please contact V: Hana-fgfg and leave your contact information for us to get back to you.
The Nasdaq index: The price has rebounded to around 24,800, marking the second consecutive trading day of recovery after the decline was halted. Currently, the key support level is around 24,600. With the Federal Reserve meeting on the agenda for today, we anticipate that after the liquidity around 24,600 is swept up during the short-term fluctuations, the rebound signal will be reactivated. For detailed positions, please consult the plugin.
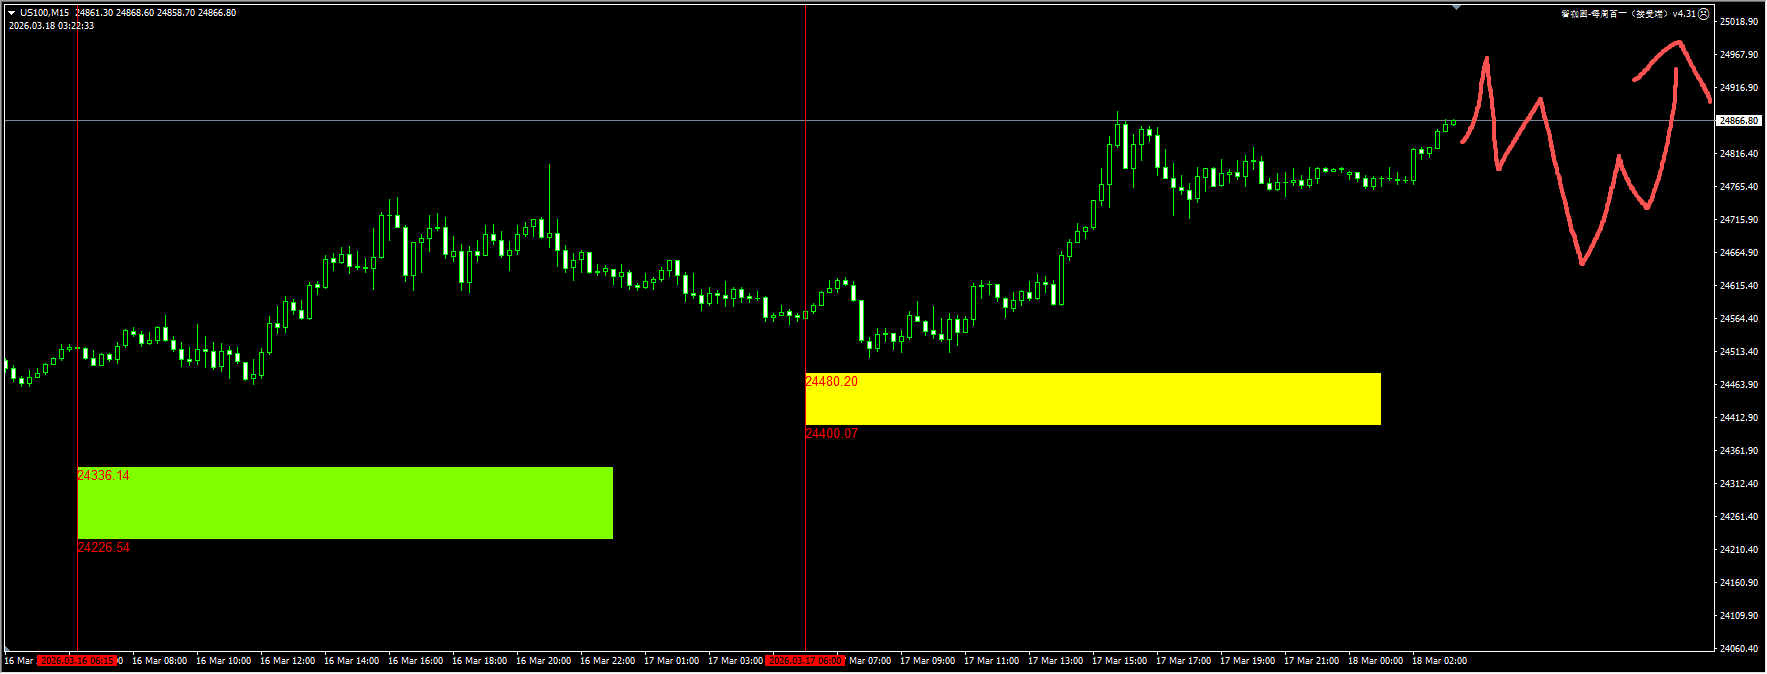
(NASDAQ 15-minute chart)
The plugin is updated from 12:00 to 13:00 every trading day. If you want to experience the same plugin as shown in the chart, please contact V: Hana-fgfg and leave your contact information in the message for us to reply.
Crude oil: Yesterday, our plugin already alerted that we should wait for the liquidity at 98/99 to be broken through and then look for the short signal when the price falls back. The overnight price movement basically met our expectations. Today, we will pay attention to the signal of a further price drop. If it occurs, we can attempt a short trade when there is a pullback. For detailed positions, please consult the plugin.
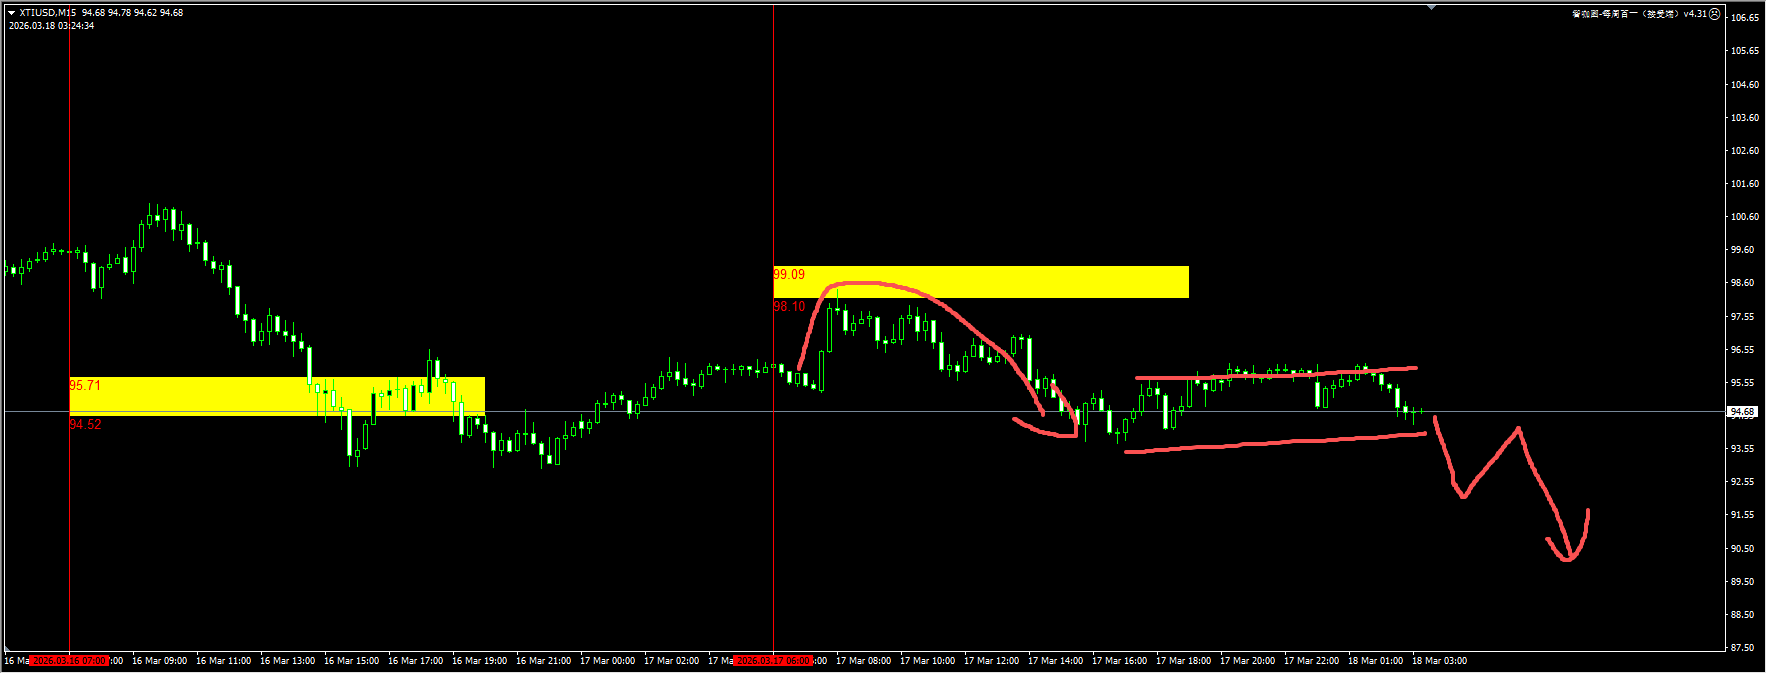
(Crude Oil 15-minute Chart)
The plugin is updated from 12:00 to 13:00 every trading day. If you want to experience the same plugin as shown in the picture, please contact V: Hana-fgfg and leave your contact information in the note for us to get back to you.
Today’s key financial data and events to focus on:
20:30 US PPI Year-on-Year for February
02:00 US Federal Reserve Interest Rate Decision (Upper Limit) as of March 18