Oil prices rose and stock markets swung wildly after President Donald Trump suggested that the United States might step up its strikes against Iran as early as Tuesday, dimming hopes for a ceasefire.
Market concerns that an impending military operation might disrupt the nascent progress in restoring energy transportation through the Strait of Hormuz pushed US crude oil prices above $112 per barrel. In a volatile trading day, the stock market held onto modest gains, with the S&P 500 index posting its biggest one-day rise since January. Bond and dollar movements were largely flat.
Trump said that the negotiations with Iran were “going well” before the Tuesday night deadline for reaching an agreement, but he also insisted that freedom of navigation through the Strait of Hormuz must be part of any deal.
Trump warned on Monday that if Iran does not accept the US conditions, the military might destroy all bridges in Iran and shut down all power plants by 12 o’clock tomorrow night.
According to the official Iranian news agency IRNA, Iran has conveyed its rejection of the ceasefire proposal to the mediator, Pakistan. Iran demands a permanent end to the war, the lifting of sanctions, the launch of reconstruction efforts, and the formulation of a security passage agreement for the Strait of Hormuz.
Jeff Buchbinder of LPL Financial said, “It’s clearly too early for market watchers to stop paying attention to geopolitical risks. For now, we believe the best course of action for investors is to remain patient.”
While traders closely monitor geopolitical developments, they are also awaiting key inflation data this week. The data shows that the growth of the US service sector economy slowed in March, with the number of employed people experiencing the largest decline since 2023, and input prices rising sharply.
Jeff Roach of LPL Financial said that mixed economic signals indicate that most businesses are facing an uncertain period.
He said, “If the dispute over the Strait of Hormuz persists until May or June, it will significantly worsen the prospects for the US and global economies. For now, given the non-farm payroll data released last Friday, the Fed policymakers can continue to adopt a ‘wait-and-see’ attitude.”
Although investors have been keeping a close eye on geopolitical risks, Mark Hackett of Nationwide said that macro data continue to suggest that the economy is resilient and the earnings outlook remains optimistic.
Michael Wilson of Morgan Stanley said, “We believe the S&P 500 is making new lows, so it’s wise to start adding to cyclical stocks and quality growth stocks where earnings remain strong, valuations have compressed and market sentiment is negative.”
Technical analysis:
The WeChat functions are subject to occasional restrictions. If you want to experience the plugin, please leave your contact information when adding a friend so that we can add you back easily!!!
Gold: The green buy limit area we alerted before the holiday was very classic, and we reaped a 5:1 profit-to-loss ratio in one wave. For today, we will closely monitor the performance of the 4600/4620 support area. If it holds, we will continue to recover the 4650/4670 level and further attack 4700. If it breaks below 4600, there is a high probability that it will sweep the liquidity below 4550. For detailed positions, please consult the plugin.
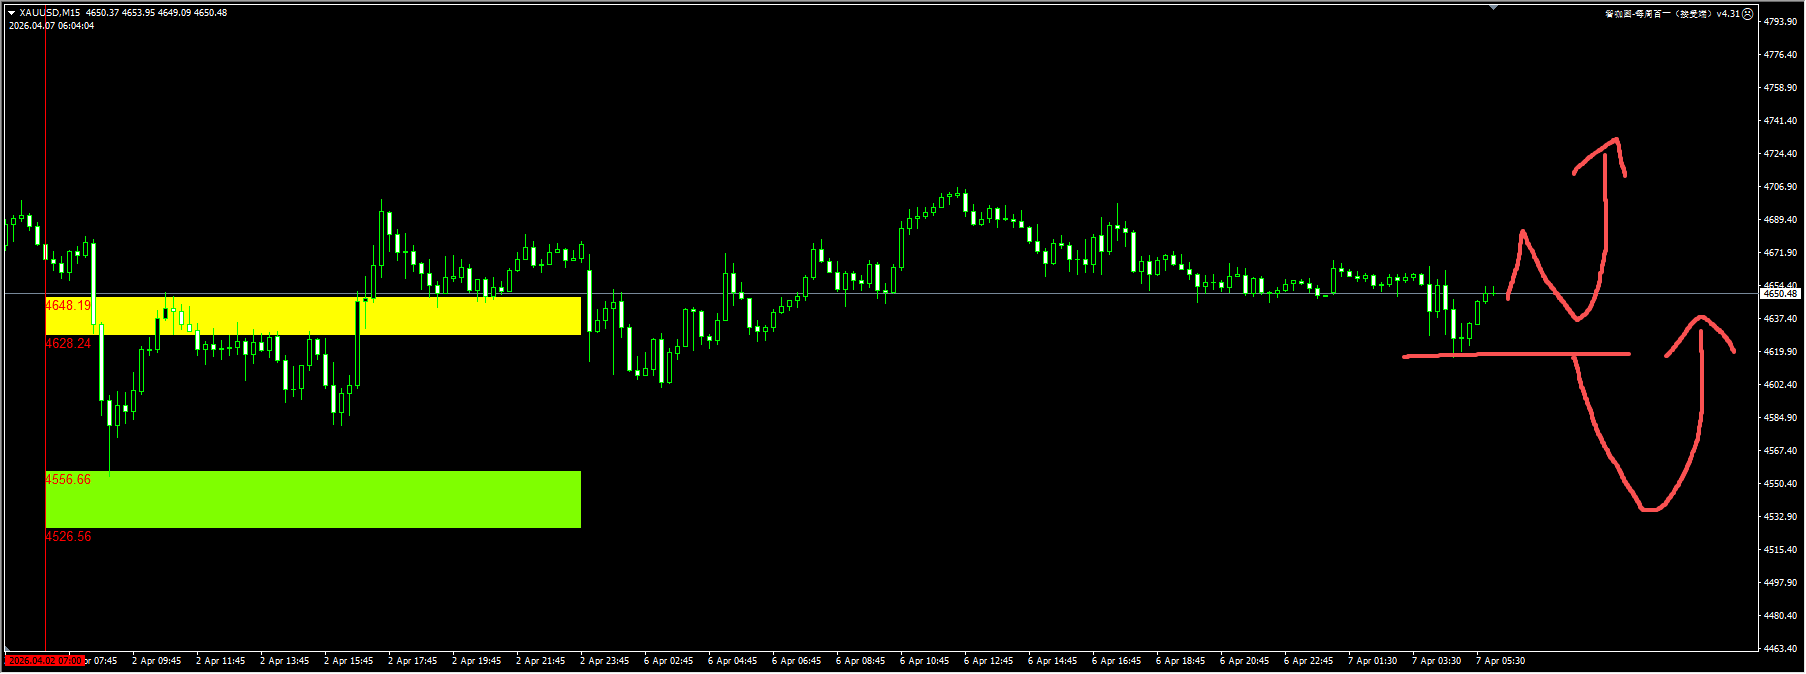
(Gold 15-minute chart)
The plugin is updated from 12:00 to 13:00 every trading day. If you want to experience the same plugin as shown in the chart, please contact V: Hana-fgfg and leave your contact information for us to get back to you.
The Nasdaq: The reminder we gave before the holiday that a rebound would occur only after the liquidity in the yellow zone was swept up is basically in line with the actual price movement. Currently, after the price has continuously swept up the liquidity, it is constrained by the supply zone resistance at 24080/24100, which is the intraday bull-bear dividing line. If the above level cannot be recaptured, the price will continue to fall towards 24000 and 23800. For detailed positions, please consult the plugin.
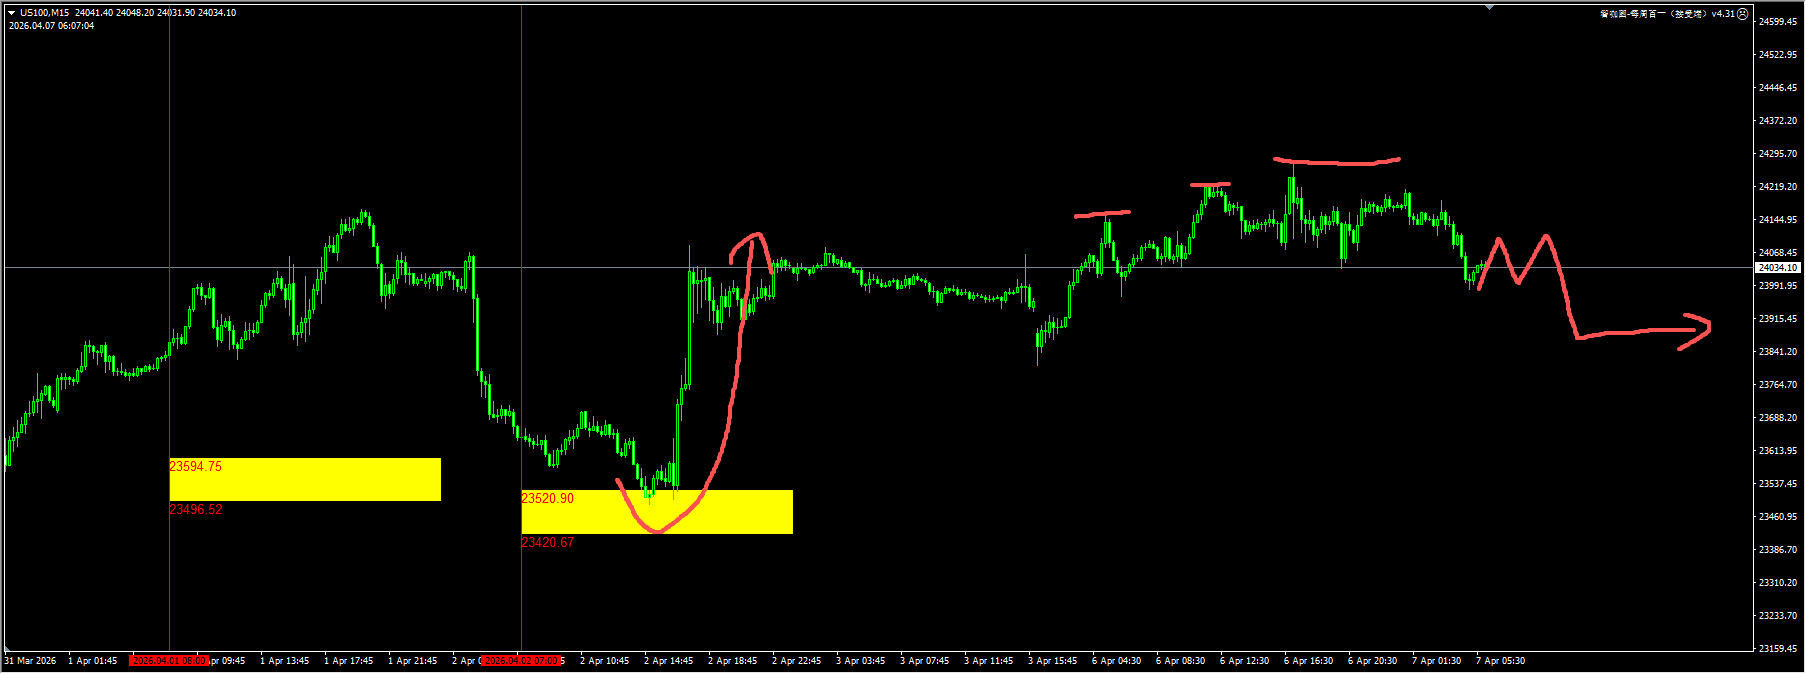
(NASDAQ 15-minute chart)
The plugin is updated from 12:00 to 13:00 every trading day. If you want to experience the same plugin as shown in the chart, please contact V: Hana-fgfg and leave your contact information in the message for us to reply.
Crude oil: Before the holiday, we hoped to see the price rise and then fall, breaking below the yellow zone. However, this trend did not occur. Subsequently, due to Trump’s tough remarks, the price rose all the way above 110. For today, we suggest observing and waiting for the expiration of Trump’s 48-hour “ultimatum”. For detailed positions, please consult the plugin.
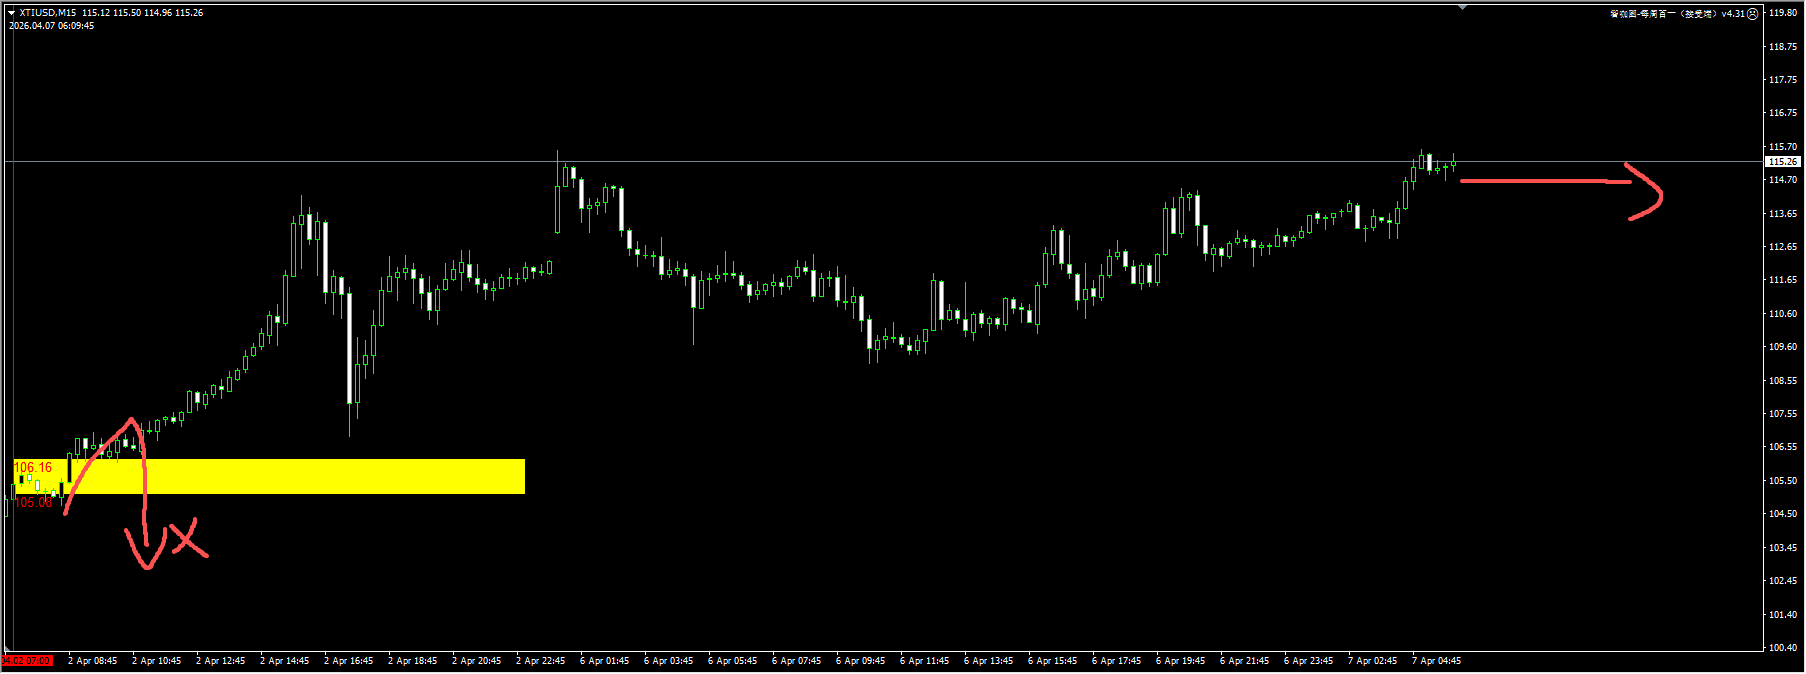
(Crude Oil 15-Minute Chart)
The plugin is updated from 12:00 to 13:00 every trading day. If you want to experience the same plugin as shown in the picture, please contact V: Hana-fgfg and leave your contact information in the note for us to get back to you.
Today’s key financial data and events to focus on:
20:30 US Durable Goods Orders (MoM) for February (Preliminary)