The Middle East war has entered its sixth day and shows no sign of ending. Affected by this, the price of gold has risen.
As the US and Israeli forces continue to bomb Iran, and Iran fires missiles at multiple countries in the region, attacking key energy infrastructure and effectively blocking the strategically significant Strait of Hormuz, investors are flocking to safer assets.
President Donald Trump expressed confidence in the US military operation, and the US subsequently sank an Iranian warship in international waters. Tehran dismissed reports that its intelligence agency had contacted Washington to seek an end to the conflict, calling them “pure lies”.
As the war continues to spread and energy prices soar, global trade may face another shock as Washington is preparing to raise import tariffs. US Treasury Secretary Scott Bessent said on Wednesday that Trump’s plan to increase the general 10% tariff to 15% is likely to take effect this week. The EU is expected to be exempt from this tariff hike.
Earlier this week, the strengthening of the US dollar and the widespread sell-off in the stock market led to a sharp one-day decline in precious metals on Tuesday. Rona O’Connell, the head of market analysis at StoneX Financial Ltd., noted in a report that since then, with investors unwinding overbought positions, there has been “little exchange speculative pressure” on gold and silver.
Technical analysis:
The functions of WeChat are subject to occasional restrictions. If you want to try the plugin, please leave your contact information when adding a friend so that we can add you back easily!!!
Gold: Yesterday, our plugin alerted that after the low-sweep liquidity in the yellow zone, a rebound should be seized. After the price continuously refreshed the lower side of the yellow zone twice within the day, a very clear recovery emerged. For today, it is suggested to pay attention to the demand zone around 5150 to see if it can rebound and continue to rise after a pullback. Then, the very crucial resistance zone of 5200/5215 needs to be recaptured and held to open up further upward space. For detailed positions, please consult the plugin.

(Gold 15-minute chart)
The plugin is updated from 12:00 to 13:00 every trading day. If you want to experience the same plugin as shown in the chart, please contact V: Hana-fgfg and leave your contact information for us to get back to you.
Nasdaq: Yesterday’s price met our expectations, bottoming out and stabilizing near the green demand zone, and rebounding by around 600 basis points. There is a clear demand zone near 24,900 within the day, but we suggest waiting for a new bullish signal after the liquidity sweep of this area before catching the rebound wave. For detailed positions, please consult the plugin.
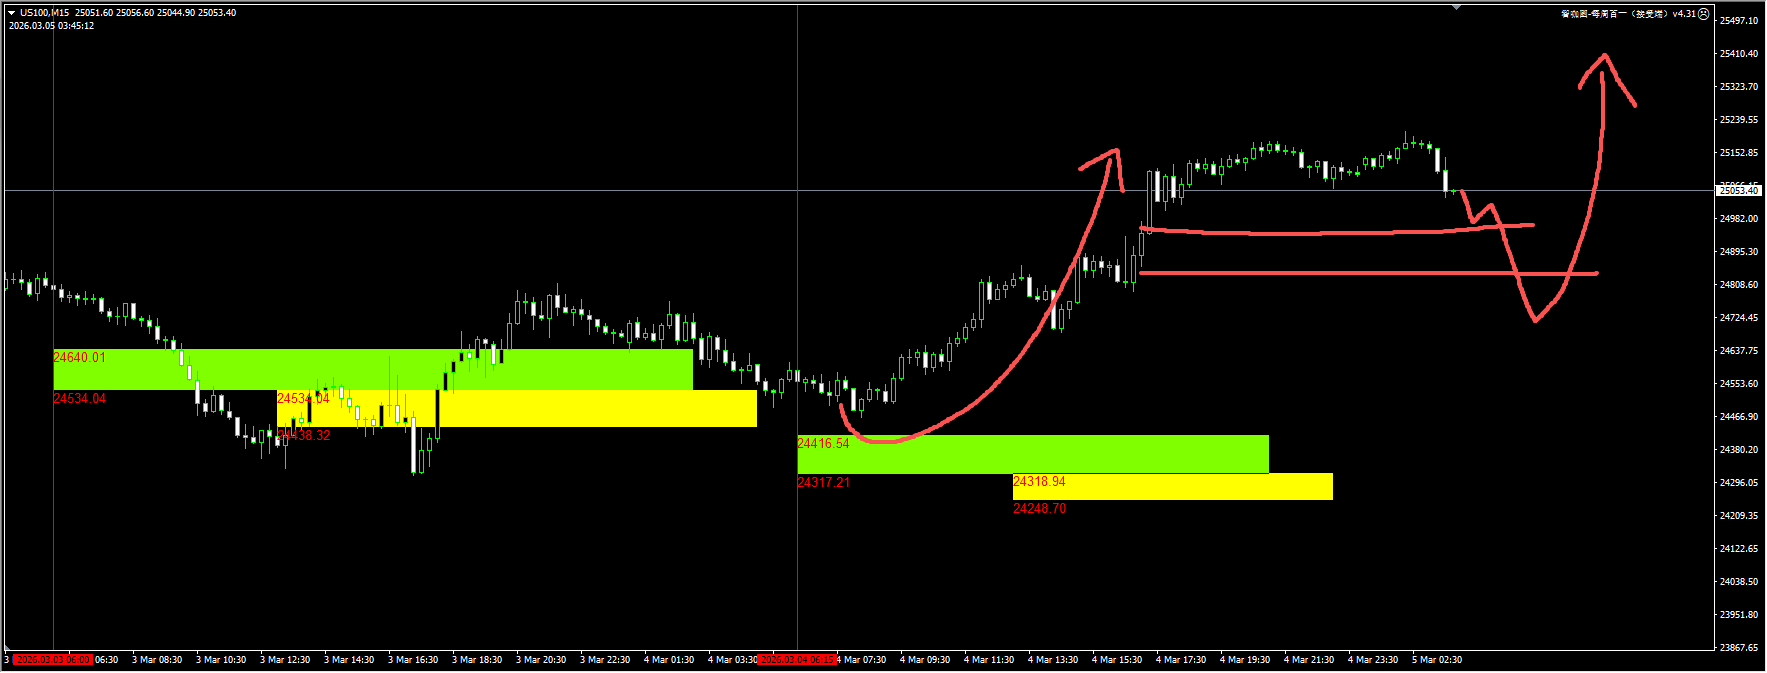
(NASDAQ 15-minute chart)
The plugin is updated from 12:00 to 13:00 every trading day. If you want to experience the same plugin as shown in the chart, please contact V: Hana-fgfg and leave your contact information in the message for us to get back to you.
Crude oil: The price shows a converging pattern while remaining at the upper part of the recent fluctuation range, indicating that the bullish momentum is relatively strong and there is a risk of an upward breakout. Within the day, one should closely monitor the signals of a breakout and participate in 1-2 times. For detailed positions, please consult the plugin.

(Crude Oil 15-Minute Chart)
The plugin is updated from 12:00 to 13:00 every trading day. If you want to experience the same plugin as shown in the picture, please contact V: Hana-fgfg and leave your contact information in the note for us to get back to you.
Today’s key financial data and events to focus on:
20:30 US Challenger Job Cuts for February (in 1,000s)
21:30 US Initial Jobless Claims for the Week Ended February 28 (in 10,000s)
