Global stock markets fell to their lowest level in over a month amid intensified selling in tech stocks and no signs of an end to the Iran conflict.
The MSCI All-Country World Index, the broadest measure of global equities, fell 0.3%, reaching its lowest level since early May. The Asia-Pacific index dropped 0.5% to a three-week low, after U.S. military airstrikes targeted multiple sites in Iran, effectively undermining the ceasefire agreement reached in April.
European stock markets are also expected to open lower. However, confidence in the U.S. market has begun to stabilize, with Nasdaq 100 index futures erasing early losses and rising 0.7%. Brent crude oil prices also reversed earlier gains, climbing 0.2% to $93.35 per barrel.
Global stock market volatility has intensified as investors grapple with overvalued tech stocks, market concentration in a handful of giant companies, and a surge in large IPOs—factors that are putting pressure on this year’s rally, which has driven markets to record highs. Meanwhile, bond traders are also digesting expectations of rising global borrowing costs, with the European Central Bank expected to announce its first rate hike since September 2023 on Thursday.
Elsewhere, U.S. Treasury yields stabilized after falling on Wednesday amid rising energy prices. The dollar weakened against most G10 currencies. The yen held steady around 160.50 against the dollar, as Bank of Japan Governor Kikuo Ito was hospitalized due to illness and is expected to miss next week’s policy meeting.
In geopolitical news, the U.S. Central Command said it had launched so-called “additional defensive strikes” after Iran retaliated on Tuesday over the downing of an American helicopter. These actions highlight growing impatience by U.S. President Donald Trump with the lack of progress in reaching a deal with Iran.
Technical Analysis:
WeChat features may be temporarily restricted. If you’d like to try the plugin, please add us as a friend and note “plugin trial” in the message, along with your contact information so we can easily get back to you!
Gold: After the CPI data release last night, gold prices initially rebounded. However, due to renewed tensions in the Middle East, prices subsequently dropped sharply to around 4000. The PPI data will be released tonight, and we are closely monitoring whether the market reaction following last night’s CPI report will repeat. If there are no new developments from the Middle East, we may consider attempting to catch a rebound signal after 20:30. For detailed positions, please consult the plugin.
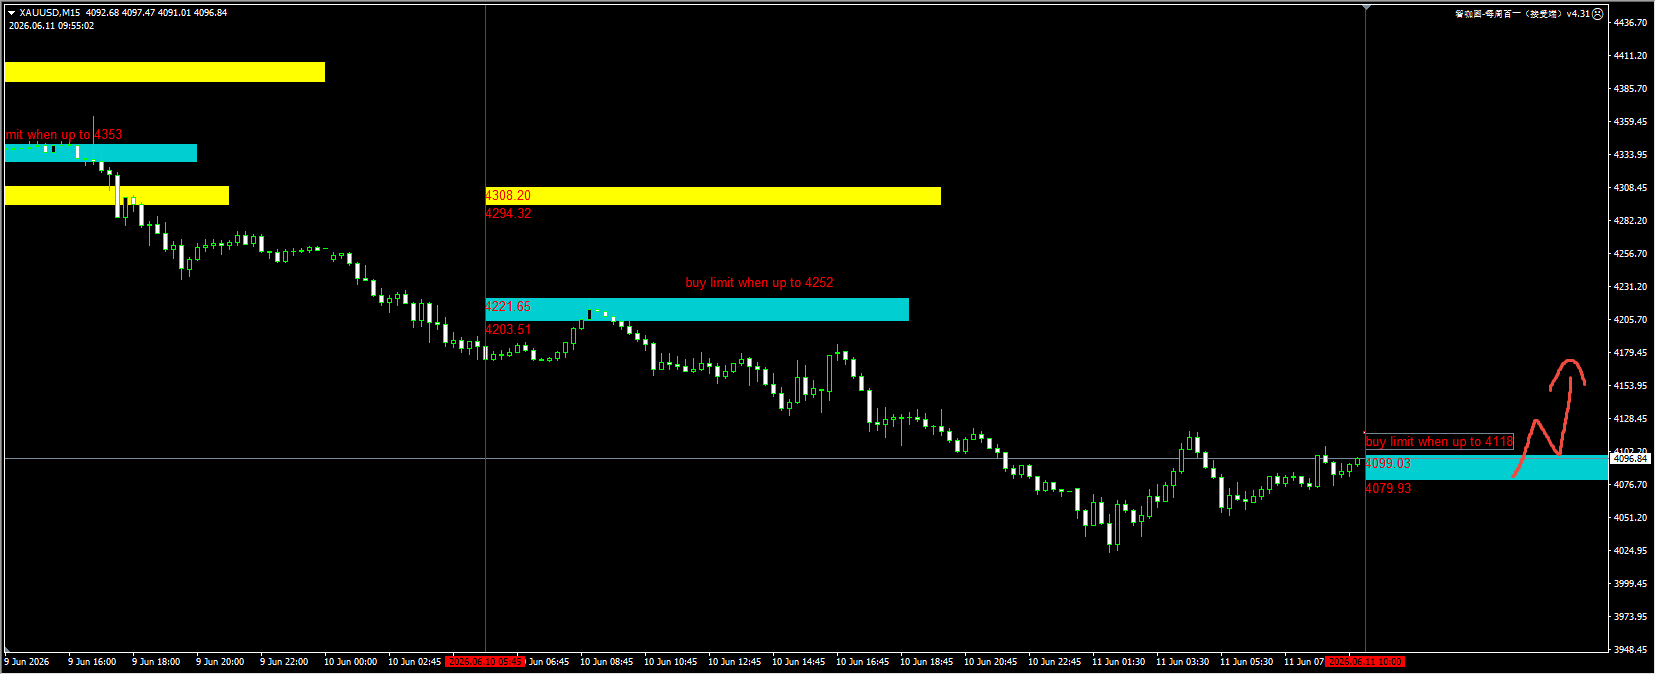
(Gold 15-minute chart)
The plugin is updated daily from 12:00 to 13:00. To try the same plugin shown in the image, please contact V: krabs1942 and leave your contact information so we can add you back.
Nasdaq: Yesterday, our plugin advised a buy stop in the green zone, and we are currently achieving nearly a 1.5x risk-reward ratio. Today, we will continue monitoring whether prices will rebound further. If, after the evening PPI data release, the price breaks above 28,950, we may consider a pullback buy. For detailed entry levels, please consult the plugin.
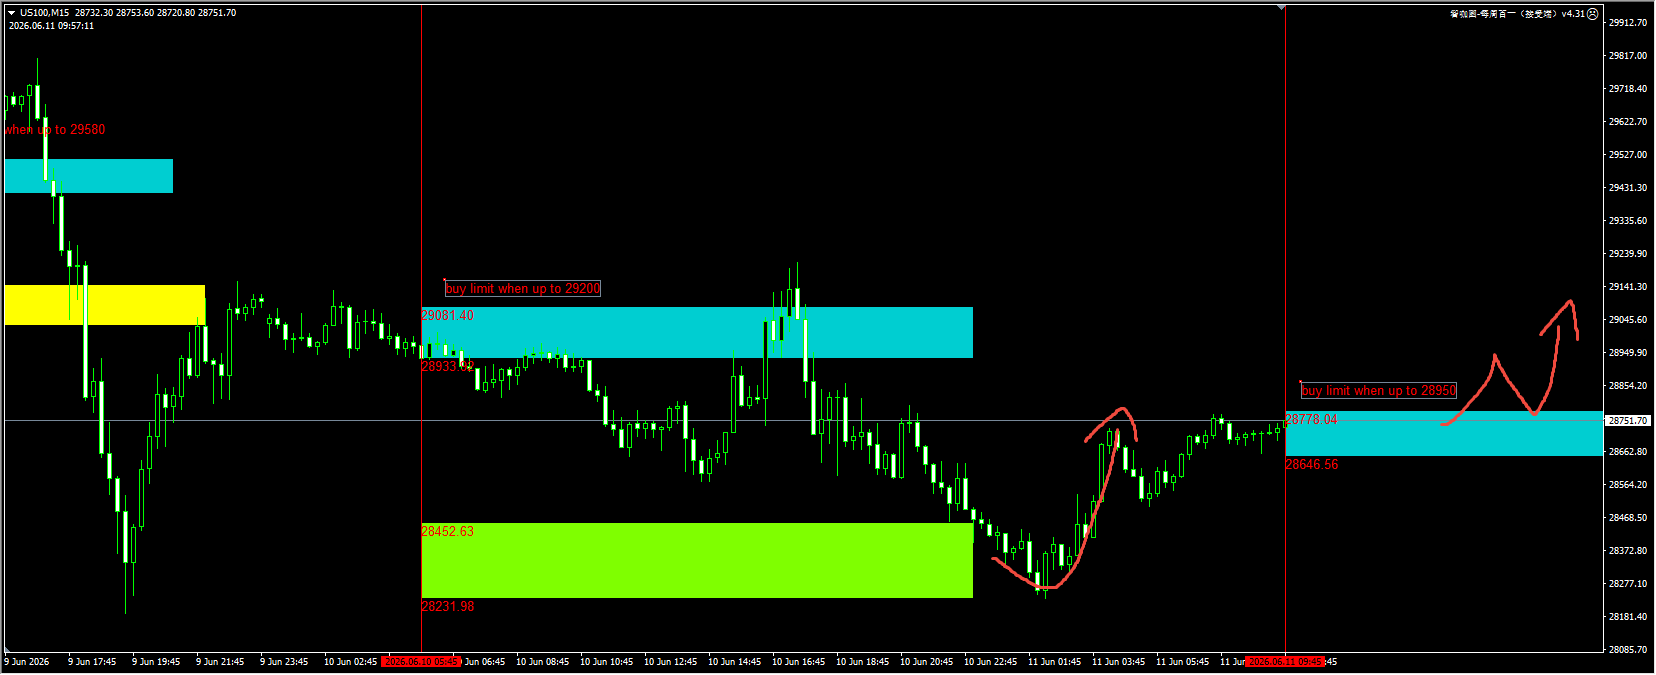
(NASDAQ 15-minute chart)
The plugin is updated daily from 12:00 to 13:00. To try the same plugin shown in the chart, please contact V: krabs1942 and leave your contact information so we can add you back.
Crude Oil: Yesterday, our plugin advised waiting for the price to sweep up into the yellow zone and gain liquidity before placing a sell stop on the subsequent pullback. So far, this approach has been quite profitable. For today, we recommend continuing to wait for a break below to around 90, then placing a sell limit order on the rebound. For detailed positioning, please consult the plugin.
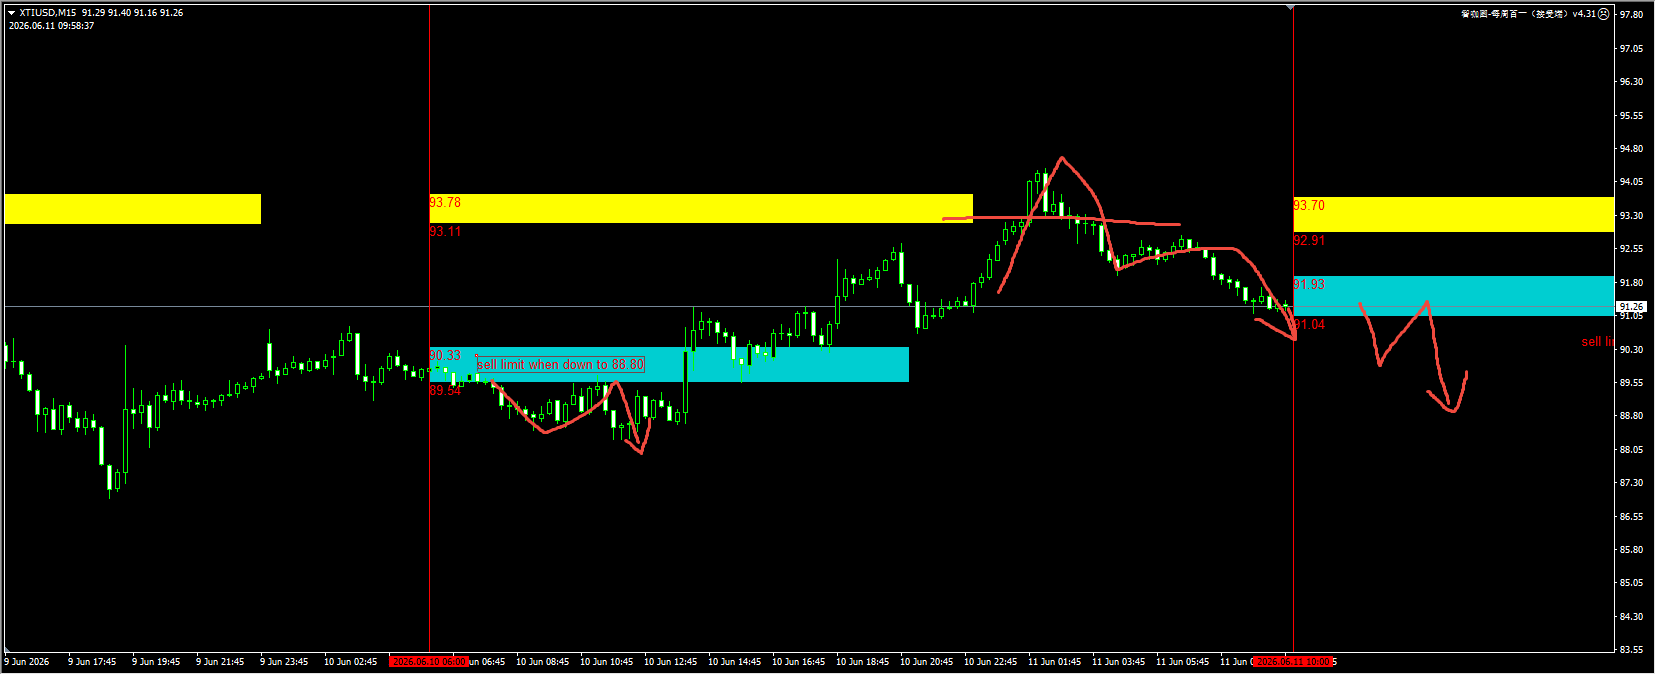
(Crude Oil 15-minute Chart)
The plugin is updated daily from 12:00 to 13:00. If you’d like to try the same plugin shown in the image, please contact V: krabs1942 and leave your contact information so we can add you back.
Today’s key financial data and events to watch:
20:30 U.S. Producer Price Index (Annual Rate) for May
20:30 U.S. Initial Jobless Claims (Seasonally Adjusted), Previous Week (in Thousands) (as of 06/06)