As expectations of further interest rate hikes by the Bank of Japan heat up, Japanese economic data has become the focus of yen traders for the first time in a decade.
This marks a shift in the mindset of the Bank of Japan since it ended its negative interest rate policy in March last year. Since the central bank began to significantly ease monetary policy in early 2016, traders have almost never doubted that stimulus measures would continue regardless of economic indicators, so it was basically safe to ignore Japanese data.
Recent exchange rate fluctuations indicate that this is no longer the case. According to data compiled by Bloomberg, within five minutes of the release of the latest wage data on February 5th, the USD/JPY exchange rate moved by 0.11%, the largest reaction since 2017. On February 17th, within five minutes of the release of the GDP data, the movement of this currency pair was 0.18%, the second largest since 2016.
Shinichiro Kadota, head of foreign exchange and interest rate strategy at Barclays Securities Japan Ltd., said: “Japanese data usually don’t have much impact on the market, but recently they have had a greater influence. This might be because the Bank of Japan is now playing a more significant driving role.”
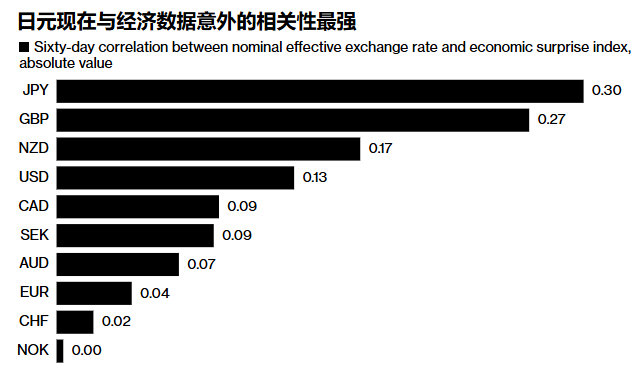
The correlation between the Japanese yen and the indicator measuring the deviation of economic data from forecasts is growing stronger. The correlation between the yen’s nominal effective exchange rate and Citigroup’s Economic Surprise Index is 0.30. Although this is still far below the 1.0 reading that indicates perfect correlation, it is higher than that of other G-10 currencies.
Jun Mura, deputy minister for international affairs at Japan’s Ministry of Finance, said there was no difference of opinion when asked about market understanding of the Bank of Japan’s recent announcement. Mura made the remarks to reporters during the G20 finance ministers and central bank governors meeting in Cape Town, South Africa.
Miyamura pointed out that the latest economic indicators in Japan show strong growth and indicate a rising inflation rate. Bank of Japan Governor Kikuo Iwata said that if the economic outlook is realized, the central bank will raise interest rates. Last month, the benchmark interest rate was raised to 0.5%.
US President Donald Trump hinted at a delay in the deadline for imposing tariffs on goods from the two countries, which has raised doubts among investors about one of the US leader’s signature policies.
Trump said that the tariffs on Mexico and Canada would take effect on April 2, while the previous deadline was early March. After that, the peso rose by 0.9% against the US dollar at one point, and the Canadian dollar recovered some ground. Later that day, a White House official said that the deadline remained March 4 and Trump had not yet decided whether to extend it again.
Win Thin, global market strategist at Brown Brothers Harriman, said: “The delay of uncertainty will leave businesses facing an uncertain outlook, which could delay investment and hiring. A threat that lasts for a month will only prolong this uncertainty.”
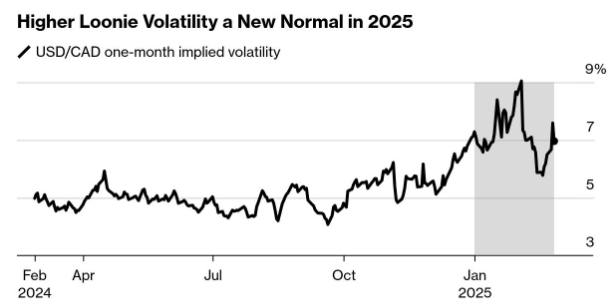
The measure of the Canadian dollar’s implied volatility over the next month has risen steadily over the past week, although it dipped slightly on Wednesday. The indicator remains well above the level seen during the US election period.
Technical analysis:
Gold: We mentioned in yesterday’s article that the price might drop to 2900 or even lower. As expected, the price fell to around 2890, forming a bat pattern, and then started to rise. We still believe that the price will show a volatile pattern today, so the strategy of buying at a low should be prepared. For detailed positions, please consult the plugin.
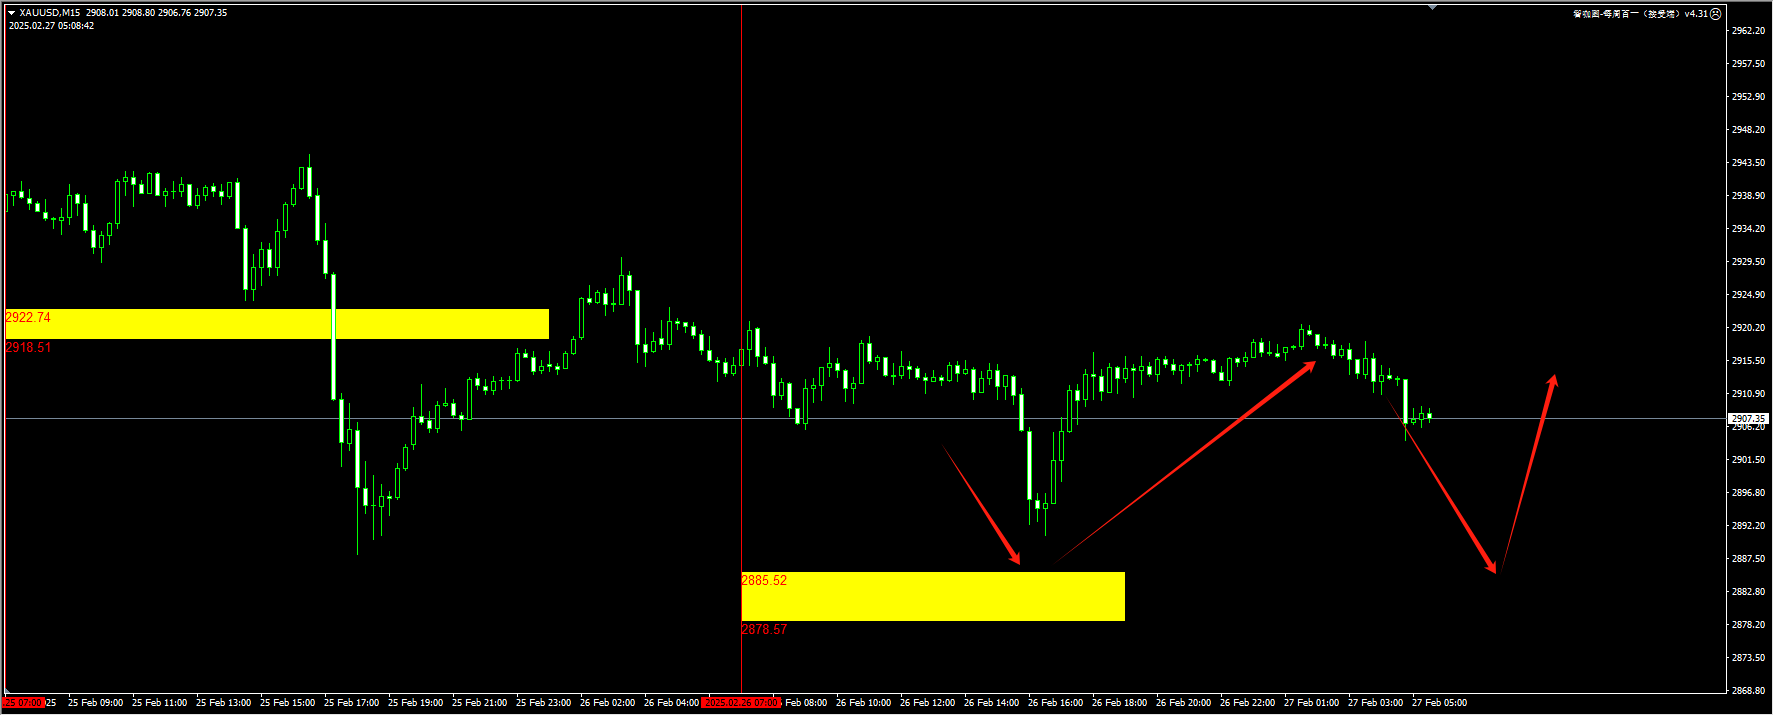
(15-minute Gold Chart)
If you want to experience the same plugin as shown in the chart, please contact V: Hana-fgfg.
The Nasdaq index: The price dropped towards the yellow zone indicated in our plugin overnight and then began to stabilize and rebound. Nvidia’s earnings report was released, sweeping through the supply zone above, but the breakthrough was not completed. Continue to pay attention to the upward test of the price within the day. If a new demand zone is formed, you can try a buy limit operation. For detailed positions, please consult the plugin.
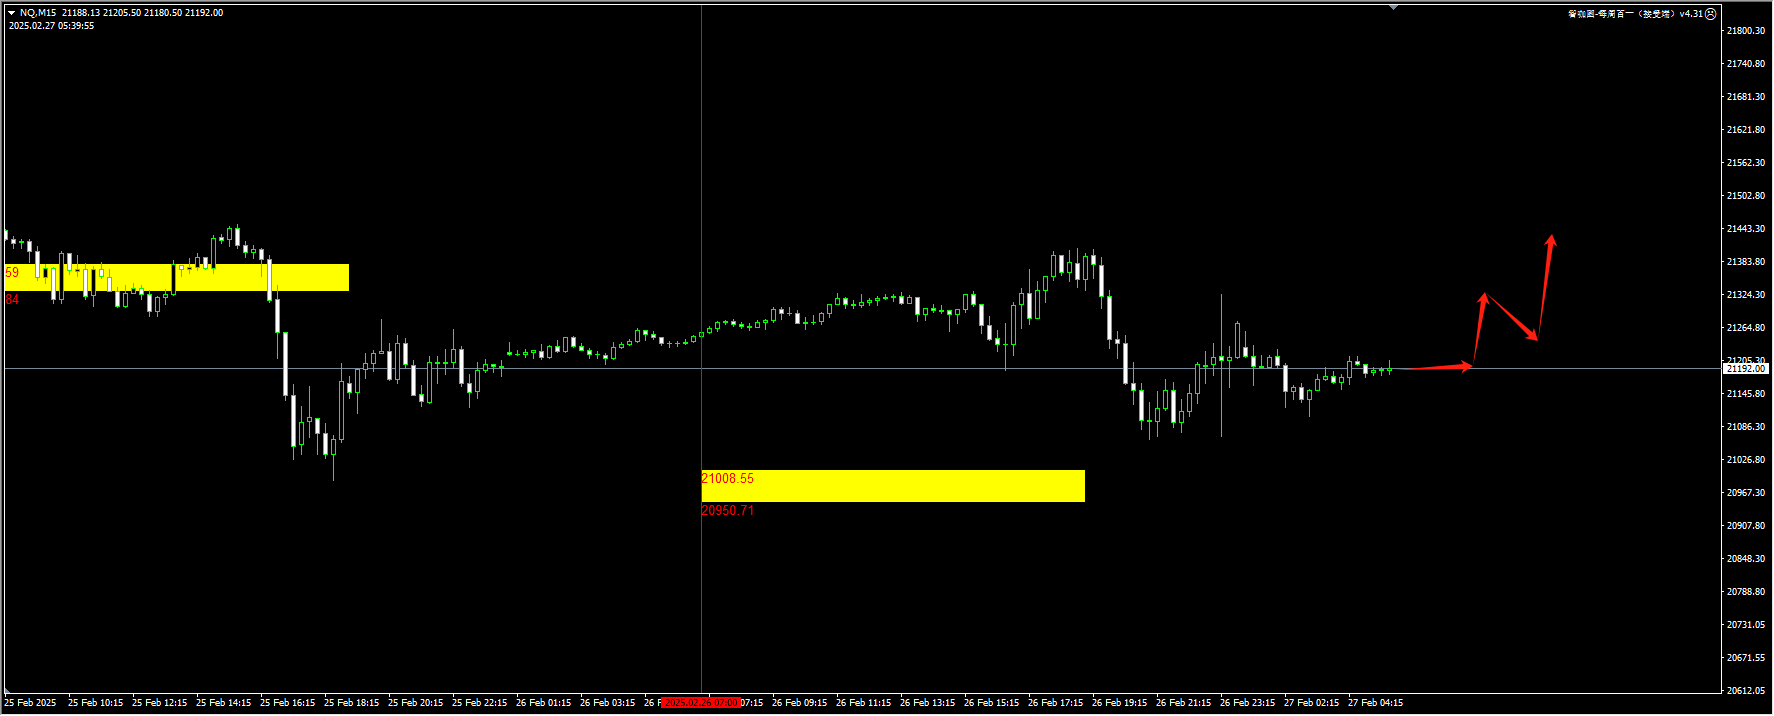
(15-minute Nasdaq Index chart)
If you want to experience the same plugin as shown in the chart, please contact V: Hana-fgfg.
Crude oil: After sweeping through liquidity overnight, the price has now stabilized around the 68.80/69 area. Today, we will continue to monitor the price’s movement above 69, which will leave a new demand area. Then, we will attempt at least one buy limit operation. For detailed positions, please consult the plugin.
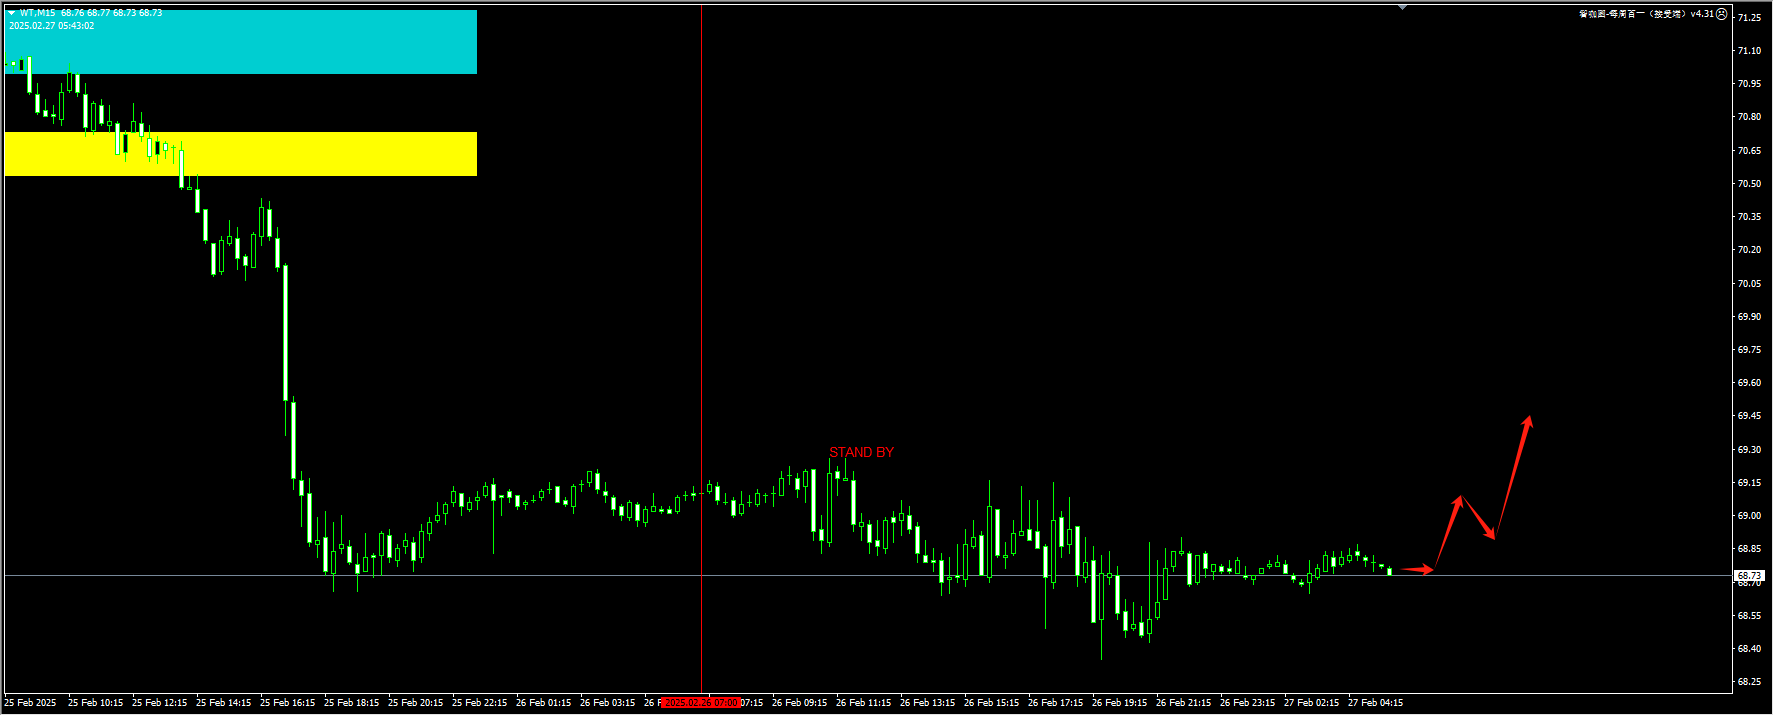
(Crude Oil 15-Minute Chart)
If you want to experience the same plugin as shown in the picture, please contact V:Hana-fgfg.
Today’s key financial data and events to focus on:
16:55 Germany’s seasonally adjusted unemployment rate for February (official)
17:00 Italy’s Istat Consumer Confidence Index for February
18:00 Eurozone Economic Sentiment Index for February
The minutes of the January monetary policy meeting of the European Central Bank in Germany will be released at 20:30.
21:30 US January Durable Goods Orders (MoM) Preliminary Estimate
23:00 US Pending Home Sales Index MoM (NAR) for January (Seasonally Adjusted)
