The U.S. dollar fell by the largest margin in over a month as demand for safe-haven currencies eased, following President Donald Trump’s pledge to make progress on ending the war with Iran.
On Thursday afternoon, Trump announced the cancellation of a military strike on Iran and indicated that a peace deal was imminent. The news caused the Bloomberg Dollar Spot Index to fall 0.3% in New York, marking its worst single-day performance since May 6. His remarks also led to a drop in oil prices and a surge in U.S. Treasury bond prices.
“Today’s afternoon news headlines were clearly more positive, boosting expectations of an imminent peace agreement,” said Alex Korn, foreign exchange strategist at Bank of America. “This is putting pressure on the dollar.”
Since the U.S. and Israel’s attacks on Iran in late February, the dollar has risen 1.6%, primarily driven by investor demand for safe assets. The dollar also shows high sensitivity to oil prices, typically rising in tandem with them.
The MSCI Asia-Pacific stock index rose 3.3%, its largest single-day gain in two months, led by the Korea Composite Stock Price Index (KOSPI), which surged 8%—a key barometer for artificial intelligence investments. After Trump announced that the U.S. “has ended the war with Iran today,” stock futures indicated that Wall Street’s benchmark indices would extend Thursday’s gains.
Ulrich Hofmann-Burchard, Global Head of Equities at UBS Global Wealth Management, said: “Although the path to resolution may not be smooth, our base expectation is that diplomacy will ultimately prevail, allowing investors to refocus on solid economic fundamentals and strong earnings growth.”
Technical Analysis:
WeChat features may be temporarily restricted. If you’d like to try the plugin, please add us as a friend and note “plugin trial” in the message, along with your contact information so we can easily get back to you!
Gold: Yesterday’s price retraced the pattern seen after the CPI data release, with the difference being no new geopolitical pressures emerged. Prices rebounded steadily, approaching $200. On Friday, we will watch for a pullback to confirm the trend, but also remain cautious of volatility following potential liquidity tightening. For detailed positioning, please consult the plugin.
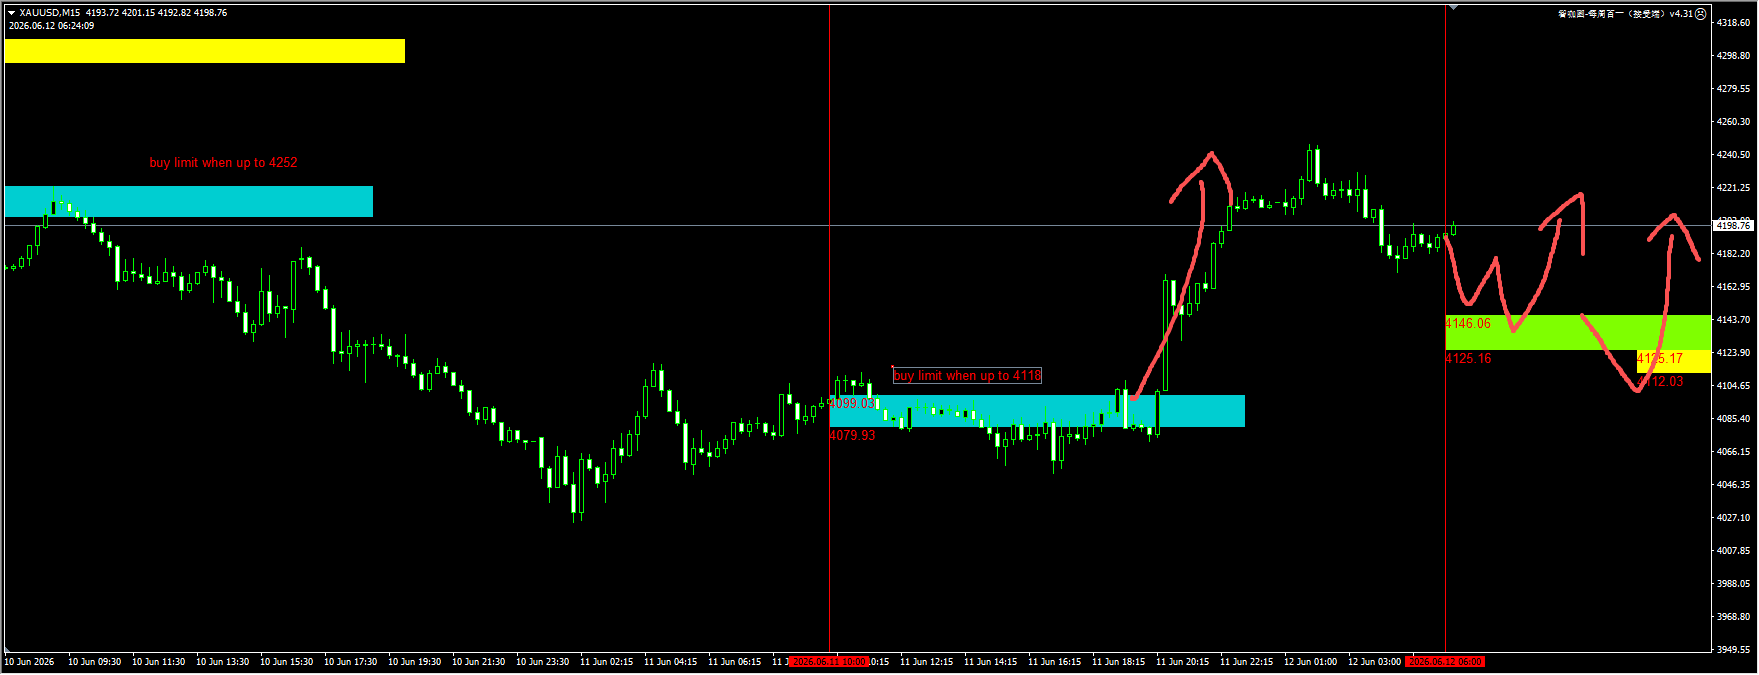
(Gold 15-minute chart)
The plugin is updated daily from 12:00 to 13:00. To try the same plugin shown in the image, please contact V: krabs1942 and leave your contact information so we can add you back.
Nasdaq: After breaking above 28,950 yesterday, the price confirmed a pullback to our plugin’s blue zone, then initiated a significant rebound. Today, we are monitoring potential pullbacks into the green zone; if the yellow zone is breached, we may also consider a rebound signal following a sweep of liquidity. For detailed levels, please consult the plugin.
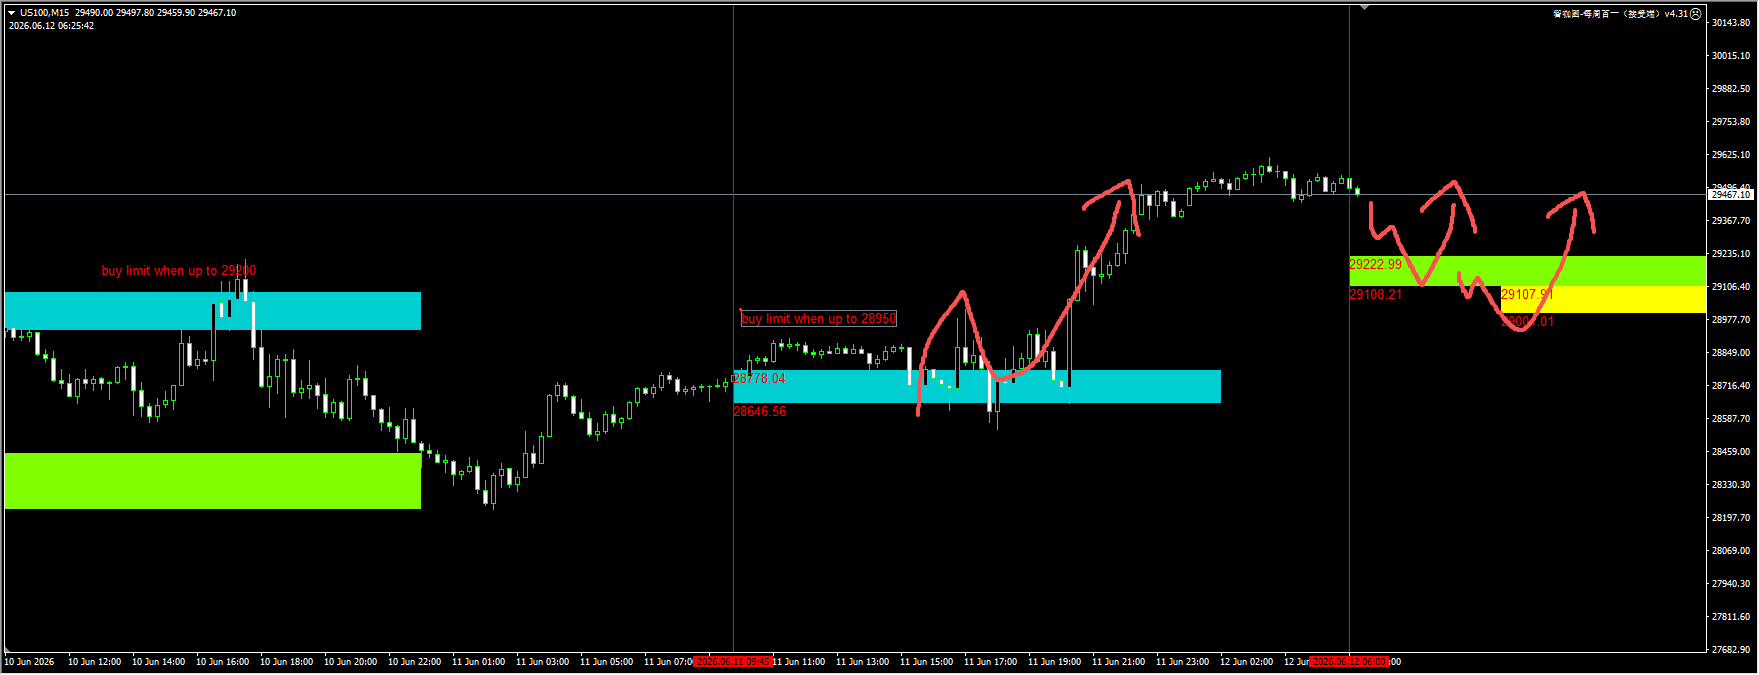
(NASDAQ 15-minute chart)
The plugin is updated daily from 12:00 to 13:00. To try the same plugin shown in the image, please contact V: krabs1942 and leave your contact information so we can add you back.
Crude Oil: Yesterday, our plugin clearly warned that after the price broke below 90.20, we should watch for a pullback to the blue zone and consider sell limit orders. The price indeed rebounded and confirmed this signal before continuing its decline below 86. Today, after capturing the bounce and clearing liquidity around 89, a new downtrend signal has emerged. For detailed positioning, please consult the plugin.
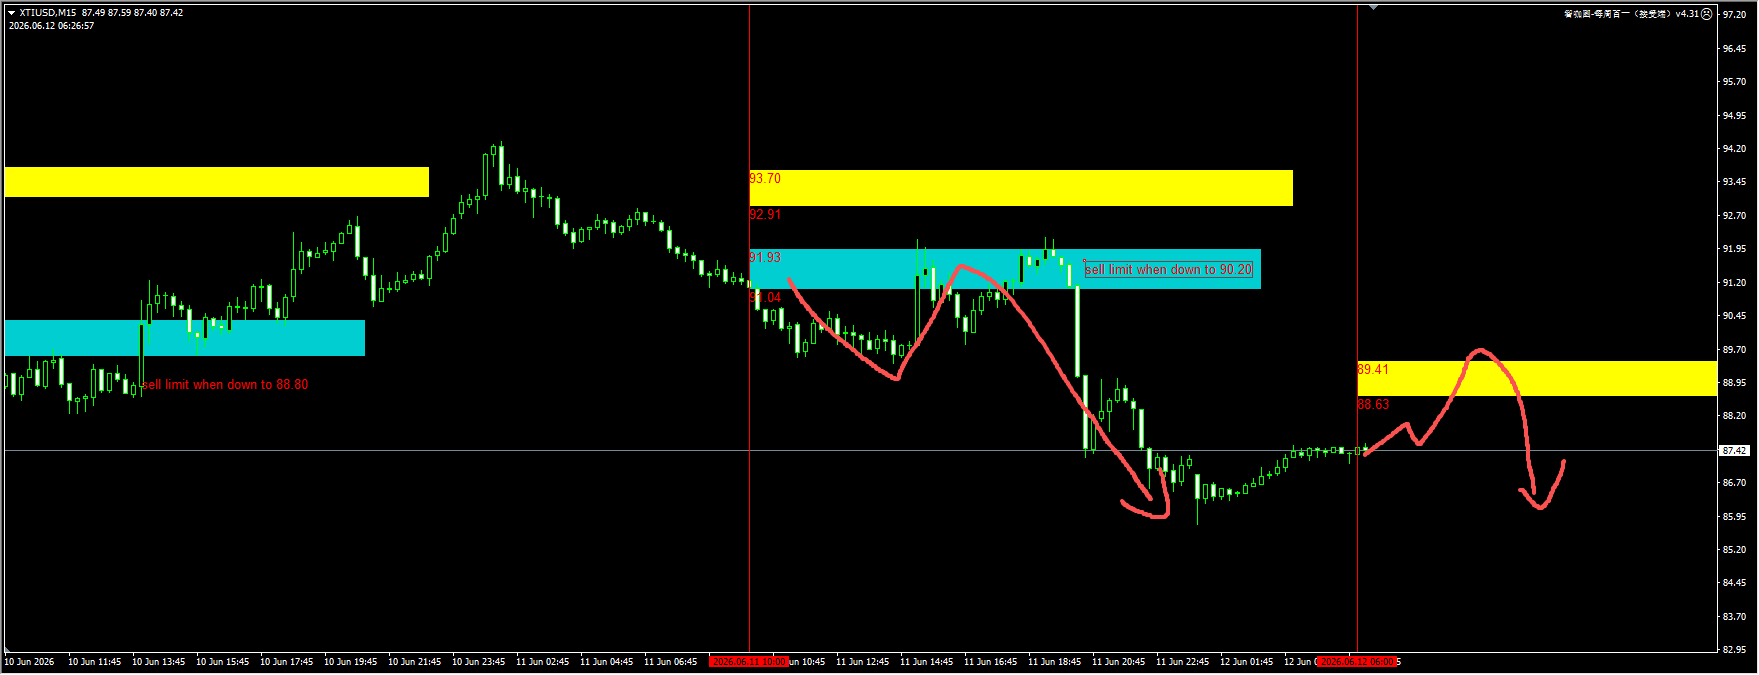
(Crude Oil 15-minute Chart)
The plugin is updated daily from 12:00 to 13:00. If you’d like to try the same plugin shown in the image, please contact V: krabs1942 and leave your contact information so we can add you back promptly.
Today’s key financial data and events to watch:
22:00 U.S. June University of Michigan Consumer Sentiment Index Preliminary Value